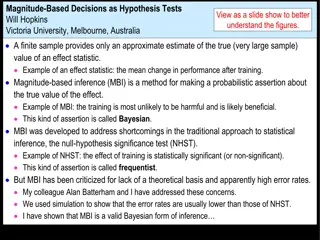
Hypothesis Testing in Statistics: Understanding Testing Procedures
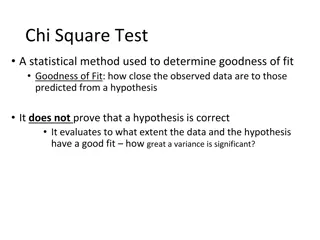
Hypothesis testing is a fundamental method in statistics to validate assumptions about population parameters. This process involves formulating null and alternative hypotheses, selecting significance levels, identifying test statistics, and making decisions based on sample evidence. By following a structured five-step procedure, researchers can determine if there is sufficient evidence to reject the null hypothesis in favor of the alternative hypothesis. Null and alternative hypotheses play key roles in hypothesis testing by establishing the default and alternative viewpoints for statistical investigations.

Download Presentation

Please find below an Image/Link to download the presentation.
The content on the website is provided AS IS for your information and personal use only. It may not be sold, licensed, or shared on other websites without obtaining consent from the author.If you encounter any issues during the download, it is possible that the publisher has removed the file from their server.
You are allowed to download the files provided on this website for personal or commercial use, subject to the condition that they are used lawfully. All files are the property of their respective owners.
The content on the website is provided AS IS for your information and personal use only. It may not be sold, licensed, or shared on other websites without obtaining consent from the author.
E N D
Presentation Transcript
Hypothesis Testing Prof. Deptii Chaudhari Assistant Professor, Department of Computer Engineering, International Institute of Information Technology, Pune Hope Foundation s International Institute of Information Technology, I IT, P-14 Rajiv Gandhi Infotech Park, Hinjawadi, Pune - 411 057 Tel - +91 20 22933441 / 2 / 3 | Website - www.isquareit.edu.in ; Email - info@isquareit.edu.in
HYPOTHESIS TESTING Hypothesis : A premise or claim that we want to test or to investigate. A hypothesis is a statement about a population parameter subject to verification. Example: Boys are taller than girls. Data must be interpreted in order to add meaning. We can interpret data by assuming a specific structure or outcome and use statistical methods to confirm or reject the assumption. The assumption is called a hypothesis and the statistical tests used for this purpose are called statistical hypothesis tests. Hope Foundation s International Institute of Information Technology, I IT, P-14 Rajiv Gandhi Infotech Park, Hinjawadi, Pune - 411 057 Tel - +91 20 22933441 / 2 / 3 | Website - www.isquareit.edu.in ; Email - info@isquareit.edu.in
HYPOTHESIS TESTING Hypothesis testing is a statistical method that is used in making statistical decisions using experimental data. Hypothesis Testing is basically an assumption that we make about the population parameter. It is a procedure based on sample evidence and probability theory to determine whether the hypothesis is a reasonable statement. The result of the test allows us to interpret whether the assumption holds or whether the assumption has been violated. Innocent till proven guilty Hope Foundation s International Institute of Information Technology, I IT, P-14 Rajiv Gandhi Infotech Park, Hinjawadi, Pune - 411 057 Tel - +91 20 22933441 / 2 / 3 | Website - www.isquareit.edu.in ; Email - info@isquareit.edu.in
FIVE-STEP PROCEDURE FOR TESTING A HYPOTHESIS Do not reject H0 Step 2 Step 3 Step 1 Step 4 Step 5 Take a sample arrive at decision State null & alternate hypothesis Select a level of significance Identify the test statistics Formulate a decision rule Reject H0 Or Accept H1 NULL HYPOTHESIS : A statement about the value of a population parameter developed for the purpose of testing numerical evidence. ALTERNATE HYPOTHESIS : A statement that is accepted if the sample data provide sufficient evidence that the null hypothesis is false. Hope Foundation s International Institute of Information Technology, I IT, P-14 Rajiv Gandhi Infotech Park, Hinjawadi, Pune - 411 057 Tel - +91 20 22933441 / 2 / 3 | Website - www.isquareit.edu.in ; Email - info@isquareit.edu.in
HYPOTHESIS TESTING Null Hypothesis The default hypothesis Or Generally accepted notion Denoted as H0 - Currently accepted value for a parameter. Usually comes from previous survey or test data. Alternative Hypothesis Denoted as Ha - Also known as Research Hypothesis Involves the claim to be tested Generally, involves someone producing a claim that they believe is true and should be tested The fact that we are proposing to be true Hope Foundation s International Institute of Information Technology, I IT, P-14 Rajiv Gandhi Infotech Park, Hinjawadi, Pune - 411 057 Tel - +91 20 22933441 / 2 / 3 | Website - www.isquareit.edu.in ; Email - info@isquareit.edu.in
H0 AND Ha Example: It is believed that the machine makes chocolate bars that are on average 5 gm. A worker claims that the machine after maintenance no longer makes 5 gm bars. What is Null Hypothesis and Alternative Hypothesis here? H0 : Mean / Average weight of bars is 5 gm. = 5 gm Ha: 5 gm The Null Hypothesis and Alternative Hypothesis are mathematical opposites. Hope Foundation s International Institute of Information Technology, I IT, P-14 Rajiv Gandhi Infotech Park, Hinjawadi, Pune - 411 057 Tel - +91 20 22933441 / 2 / 3 | Website - www.isquareit.edu.in ; Email - info@isquareit.edu.in
NULL Vs ALTERNATIVE HYPOTHESIS Null Hypothesis (H0) It is a statement about a population parameter Alternative Hypothesis (H1) It is that statement which directly contradicts the null hypothesis. We test the likelihood of this statement being true in order to decide whether to accept or reject our alternative hypothesis. We determine whether or not to accept or reject this statement based on the likelihood of the null or opposite hypothesis being true. Can include = , <= or >= sign Can include , > or < sign Hope Foundation s International Institute of Information Technology, I IT, P-14 Rajiv Gandhi Infotech Park, Hinjawadi, Pune - 411 057 Tel - +91 20 22933441 / 2 / 3 | Website - www.isquareit.edu.in ; Email - info@isquareit.edu.in
SELECTING A LEVEL OF SIGNIFICANCE Statistical Significance - Where do we draw the line to make a decision? The probability of rejecting the null hypothesis when it is true. It is also sometimes called the level of risk. Refers to the degree of significance in which we accept or reject the null-hypothesis. 100% accuracy is not possible for accepting or rejecting a hypothesis, so we therefore select a level of significance that is usually 5%. Example: Monday : Sample of 50 bars Avg = 5.12 gm (a little bit more but ok) Wednesday: Sample of 50 bars Avg = 5.72 gm (A little bit more and a little significant) Saturday: Sample of 50 bars Avg = 7.23 gm (Way too off) Here comes the statistics : We cannot make decisions on whim but should make decisions with proofs. We collect the data, put it some equations and then decide to accept or reject the Hypothesis. Hope Foundation s International Institute of Information Technology, I IT, P-14 Rajiv Gandhi Infotech Park, Hinjawadi, Pune - 411 057 Tel - +91 20 22933441 / 2 / 3 | Website - www.isquareit.edu.in ; Email - info@isquareit.edu.in
LEVEL OF CONFIDENCE C Level of Confidence C : How confident are we in our decision? Level of Significance : = 1 - C If LoC (Level of Confidence) = 95 % Confidence = 0.95 = 1 - 0.95 = 0.05 Problem 1: A company has stated that their straw machine makes straws that are 4 mm in diameter. A worker believes the machine no longer makes straws of this size and samples 100 straws to perform a hypothesis test with 99% confidence. H0 : = 4 mm Ha: 4 mm Sample size n = 100 Confidence C = 0.99 = 1 - C = 0.01 Hope Foundation s International Institute of Information Technology, I IT, P-14 Rajiv Gandhi Infotech Park, Hinjawadi, Pune - 411 057 Tel - +91 20 22933441 / 2 / 3 | Website - www.isquareit.edu.in ; Email - info@isquareit.edu.in
EXAMPLE Problem 3: The school claims that at least 60% of students bring a phone to school. A teacher believes that this number is too high and randomly samples 25 students to test at the level of significance of 0.02. What is the Null hypothesis and Alternative Hypothesis and level of confidence? H0 : Proportion P >= 0.60 Ha : P < 0.60 = 0.02 C = 1 - C = 1 - 0.02 = 0.08 Hence the level of confidence is 80 %. Hope Foundation s International Institute of Information Technology, I IT, P-14 Rajiv Gandhi Infotech Park, Hinjawadi, Pune - 411 057 Tel - +91 20 22933441 / 2 / 3 | Website - www.isquareit.edu.in ; Email - info@isquareit.edu.in
EXAMPLE Suppose a firm manufacturing personal computers uses many printed circuit boards. Suppliers bid on the boards, and the one with the lowest bid is awarded a sizable contract. Suppose the contract specifies that the computer manufacturer s quality- assurance department will sample all incoming shipments of circuit boards. If more than 6 percent of the boards sampled are substandard, the shipment will be rejected. Here, the null hypothesis is that the incoming shipment of boards contains 6 percent or less substandard boards. The alternate hypothesis is that more than 6 percent of the boards are defective. Hope Foundation s International Institute of Information Technology, I IT, P-14 Rajiv Gandhi Infotech Park, Hinjawadi, Pune - 411 057 Tel - +91 20 22933441 / 2 / 3 | Website - www.isquareit.edu.in ; Email - info@isquareit.edu.in
A sample of 50 circuit boards received July 21 from Prime Electronics revealed that 4 boards, or 8 percent, were substandard. The shipment was rejected because it exceeded the maximum of 6 percent substandard printed circuit boards. If the shipment was actually substandard, then the decision to return the boards to the supplier was correct. However, suppose the 4 substandard printed circuit boards selected in the sample of 50 were the only substandard boards in the shipment of 4,000 boards. Then only 1/10 of 1 percent were defective (4/4,000 = .001). In that case, less than 6 percent of the entire shipment was substandard and rejecting the shipment was an error. In terms of hypothesis testing, we rejected the null hypothesis that the shipment was not substandard when we should have accepted the null hypothesis. Hope Foundation s International Institute of Information Technology, I IT, P-14 Rajiv Gandhi Infotech Park, Hinjawadi, Pune - 411 057 Tel - +91 20 22933441 / 2 / 3 | Website - www.isquareit.edu.in ; Email - info@isquareit.edu.in
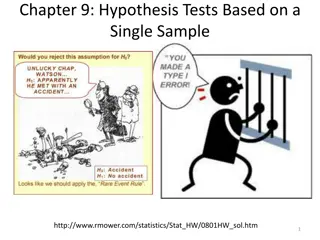
ERRORS IN HYPOTHESIS TESTING TYPE I ERROR Rejecting the null hypothesis, H0, when it is true. Type I error is denoted by alpha . In hypothesis testing, the normal curve that shows the critical region is called the alpha region TYPE II ERROR Accepting the null hypothesis when it is false. Type II errors are denoted by beta . In Hypothesis testing, the normal curve that shows the acceptance region is called the beta region. Hope Foundation s International Institute of Information Technology, I IT, P-14 Rajiv Gandhi Infotech Park, Hinjawadi, Pune - 411 057 Tel - +91 20 22933441 / 2 / 3 | Website - www.isquareit.edu.in ; Email - info@isquareit.edu.in
ERRORS IN HYPOTHESIS TESTING Researcher Null Hypothesis Does not reject H0 Rejects H0 H0 is true Correct decision Type I error Correct decision H0 is false Type II error Hope Foundation s International Institute of Information Technology, I IT, P-14 Rajiv Gandhi Infotech Park, Hinjawadi, Pune - 411 057 Tel - +91 20 22933441 / 2 / 3 | Website - www.isquareit.edu.in ; Email - info@isquareit.edu.in
THANK YOU !! Hope Foundation s International Institute of Information Technology, I IT, P-14 Rajiv Gandhi Infotech Park, Hinjawadi, Pune - 411 057 Tel - +91 20 22933441 / 2 / 3 | Website - www.isquareit.edu.in ; Email - info@isquareit.edu.in