Hypothesis Testing Process & Telepathy Experiment Analysis
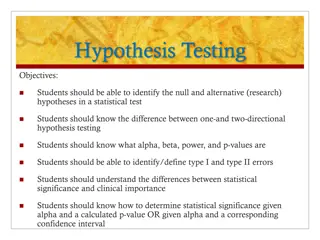
Understand the hypothesis testing process and analyze Michelle's claim of telepathy through a simple experiment. Evaluate the null and alternate hypotheses, significance level, statistical model, and conclusion interpretation at a 5% level of significance.

Download Presentation

Please find below an Image/Link to download the presentation.
The content on the website is provided AS IS for your information and personal use only. It may not be sold, licensed, or shared on other websites without obtaining consent from the author. If you encounter any issues during the download, it is possible that the publisher has removed the file from their server.
You are allowed to download the files provided on this website for personal or commercial use, subject to the condition that they are used lawfully. All files are the property of their respective owners.
The content on the website is provided AS IS for your information and personal use only. It may not be sold, licensed, or shared on other websites without obtaining consent from the author.
E N D
Presentation Transcript
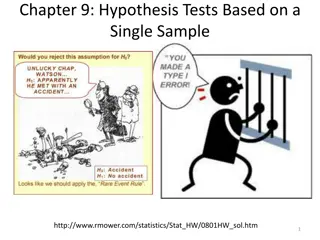
The process for setting up a hypothesis test: State your NULL HYPOTHESIS, H0 State your ALTERNATE HYPOTHESIS, H1 State the significance level e.g. Ho: p = 0.2 or H0 : = 4 e.g. H1: p > 0.2 or H1 : 4 e.g. S.L. = 5% (one or two tailed) e.g. X ~ B(10, 0.2) or X ~ Po(4) State the statistical model Test your statistic against the significance level e.g. P(X > 5) e.g. Whether you accept H0 or not and what this means in context State your conclusion in context
Michelle said she was telepathic. She constructed a simple experiment to confirm this. She placed four different coloured discs in a bag, selected one, ensuring her friend could not see it, concentrated on the colour and then asked her friend to guess the colour. She repeated the process 20 times and her friend managed to guess correctly 9 times. Michelle felt this result indicated that she was telepathic. Would you agree? Test her claim at the 5% significance level. H0 : p = 0.25 State your NULL HYPOTHESIS (H0)
Michelle said she was telepathic. She constructed a simple experiment to confirm this. She placed four different coloured discs in a bag, selected one, ensuring her friend could not see it, concentrated on the colour and then asked her friend to guess the colour. She repeated the process 20 times and her friend managed to guess correctly 9 times. Michelle felt this result indicated that she was telepathic. Would you agree? Test her claim at the 5% significance level. H0 : p = 0.25 H1 : p > 0.25 State your ALTERNATE HYPOTHESIS (H1)
Michelle said she was telepathic. She constructed a simple experiment to confirm this. She placed four different coloured discs in a bag, selected one, ensuring her friend could not see it, concentrated on the colour and then asked her friend to guess the colour. She repeated the process 20 times and her friend managed to guess correctly 9 times. Michelle felt this result indicated that she was telepathic. Would you agree? Test her claim at the 5% significance level. S.L. : 5% (one tailed) H0 : p = 0.25 H1 : p > 0.25 State your SIGNIFICANCE LEVEL
Michelle said she was telepathic. She constructed a simple experiment to confirm this. She placed four different coloured discs in a bag, selected one, ensuring her friend could not see it, concentrated on the colour and then asked her friend to guess the colour. She repeated the process 20 times and her friend managed to guess correctly 9 times. Michelle felt this result indicated that she was telepathic. Would you agree? Test her claim at the 5% significance level. S.L. : 5% (one tailed) H0 : p = 0.25 H1 : p > 0.25 X ~ B(20, 0.25) State the statistical model
Michelle said she was telepathic. She constructed a simple experiment to confirm this. She placed four different coloured discs in a bag, selected one, ensuring her friend could not see it, concentrated on the colour and then asked her friend to guess the colour. She repeated the process 20 times and her friend managed to guess correctly 9 times. Michelle felt this result indicated that she was telepathic. Would you agree? Test her claim at the 5% significance level. S.L. : 5% (one tailed) H0 : p = 0.25 H1 : p > 0.25 X ~ B(20, 0.25) = 1 0.9591 = 0.0409 = 4.09% P(X 9) = 1 P(X 8) Test your statistic
Michelle said she was telepathic. She constructed a simple experiment to confirm this. She placed four different coloured discs in a bag, selected one, ensuring her friend could not see it, concentrated on the colour and then asked her friend to guess the colour. She repeated the process 20 times and her friend managed to guess correctly 9 times. Michelle felt this result indicated that she was telepathic. Would you agree? Test her claim at the 5% significance level. S.L. : 5% (one tailed) H0 : p = 0.25 H1 : p > 0.25 X ~ B(20, 0.25) = 1 0.9591 = 0.0409 = 4.09% P(X 9) = 1 P(X 8) 4.09% is below the 5% significance level Reject H0 and accept H1, p > 0.25 Evidence to suggest she may be telepathic Make a conclusion in context
Every year a statistics teacher takes her class out to observe the traffic passing the school gates during a Tuesday lunch hour. Over the years she has established that the average number of lorries passing the gates in a lunch hour is 7.5. During the course of the last 12 months, a new bypass has been built and the number of lorries passing the school gates in this year s experiment was 4. Test, at the 5% level, whether or not the mean number of lorries passing the school gates during a Tuesday lunch hour has reduced. H0 : = 7.5 State your NULL HYPOTHESIS (H0)
Every year a statistics teacher takes her class out to observe the traffic passing the school gates during a Tuesday lunch hour. Over the years she has established that the average number of lorries passing the gates in a lunch hour is 7.5. During the course of the last 12 months, a new bypass has been built and the number of lorries passing the school gates in this year s experiment was 4. Test, at the 5% level, whether or not the mean number of lorries passing the school gates during a Tuesday lunch hour has reduced. H1 : < 7.5 H0 : = 7.5 State your ALTERNATE HYPOTHESIS (H1)
Every year a statistics teacher takes her class out to observe the traffic passing the school gates during a Tuesday lunch hour. Over the years she has established that the average number of lorries passing the gates in a lunch hour is 7.5. During the course of the last 12 months, a new bypass has been built and the number of lorries passing the school gates in this year s experiment was 4. Test, at the 5% level, whether or not the mean number of lorries passing the school gates during a Tuesday lunch hour has reduced. S.L. : 5% (one tailed) H1 : < 7.5 H0 : = 7.5 State the significance level
Every year a statistics teacher takes her class out to observe the traffic passing the school gates during a Tuesday lunch hour. Over the years she has established that the average number of lorries passing the gates in a lunch hour is 7.5. During the course of the last 12 months, a new bypass has been built and the number of lorries passing the school gates in this year s experiment was 4. Test, at the 5% level, whether or not the mean number of lorries passing the school gates during a Tuesday lunch hour has reduced. S.L. : 5% (one tailed) H1 : < 7.5 X ~ Po(7.5) H0 : = 7.5 State the statistical model
Every year a statistics teacher takes her class out to observe the traffic passing the school gates during a Tuesday lunch hour. Over the years she has established that the average number of lorries passing the gates in a lunch hour is 7.5. During the course of the last 12 months, a new bypass has been built and the number of lorries passing the school gates in this year s experiment was 4. Test, at the 5% level, whether or not the mean number of lorries passing the school gates during a Tuesday lunch hour has reduced. S.L. : 5% (one tailed) H1 : < 7.5 X ~ Po(7.5) H0 : = 7.5 P(X 4) = 0.1321 = 13.21% Test your statistic
Every year a statistics teacher takes her class out to observe the traffic passing the school gates during a Tuesday lunch hour. Over the years she has established that the average number of lorries passing the gates in a lunch hour is 7.5. During the course of the last 12 months, a new bypass has been built and the number of lorries passing the school gates in this year s experiment was 4. Test, at the 5% level, whether or not the mean number of lorries passing the school gates during a Tuesday lunch hour has reduced. S.L. : 5% (one tailed) H1 : < 7.5 X ~ Po(7.5) H0 : = 7.5 P(X 4) = 0.1321 = 13.21% 13.21% is above the 5% significance level Insufficient evidence to reject H0 Mean number of lorries hasn t reduced Make a conclusion
In a sack containing a large number of beads are coloured gold and the remainder are of different colours. A group of children use some of the beads in a craft lesson and do not replace them. Afterwards the teacher wishes to know whether or not the proportion of gold beads left in the sack has changed. He selects a random sample of 20 beads and finds that 2 of them are coloured gold. Stating your hypotheses clearly test, at the 10% level of significance, whether or not there is evidence that the proportion of gold beads has changed. X ~ B(20, 0.25) Two tailed test S.L. : 5% each side H1: p 0.25 H0 : p = 0.25 P(X 2) = 0.0913 = 9.13% 5% 5% 2 5 9.13% is above the 5% significance level Insufficient evidence to reject H0 Proportion of gold beads hasn t changed
In a sack containing a large number of beads are coloured gold and the remainder are of different colours. A group of children use some of the beads in a craft lesson and do not replace them. Afterwards the teacher wishes to know whether or not the proportion of gold beads left in the sack has changed. He selects a random sample of 20 beads and finds that 2 of them are coloured gold. Stating your hypotheses clearly test, at the 10% level of significance, whether or not there is evidence that the proportion of gold beads has changed. X ~ B(20, 0.25) S.L. : 5% each side H1: p 0.25 H0 : p = 0.25 5% 5% 5 CRITICAL REGION The region where H0 would be rejected
X ~ B(20, 0.25) S.L. : 5% each side H1: p 0.25 H0 : p = 0.25 5% 5% 5 b a Critical Region P(X a) = 0.05 P(X b) = 0.05 P(X b-1) = 0.95 P(X 7) = 0.8982 P(X 8) = 0.9591 X 1 and X 9 P(X 1) = 0.0243 P(X 2) = 0.0913 ACTUAL significance level 0.0243 + (1 0.9591) = 0.0652 or 6.52%
Past records show that 20% of customers who buy crisps from a large supermarket buy them in single packets. During a particular day a random sample of 25 customers who had bought crisps was taken and 2 of them had bought them in single packets. (a) Use these data to test, at the 5% level of significance, whether or not the percentage of customers who bought crisps in single packets that day was lower than usual. State your hypotheses clearly. At the same supermarket, the manager thinks that the probability of a customer buying a bumper pack of crisps is 0.03. To test whether or not this hypothesis is true the manager decides to take a random sample of 300 customers. (b) Stating your hypotheses clearly, find the critical region to enable the manager to test whether or not there is evidence that the probability is different from 0.03. The significance level should be 5%. (c) Write down the significance level of this test.
Past records show that 20% of customers who buy crisps from a large supermarket buy them in single packets. During a particular day a random sample of 25 customers who had bought crisps was taken and 2 of them had bought them in single packets. (a) Use these data to test, at the 5% level of significance, whether or not the percentage of customers who bought crisps in single packets that day was lower than usual. State your hypotheses clearly. H1 : p < 0.2 H0 : p = 0.2 X ~ B(25, 0.2) S.L. : 5% (one tailed) P(X 2) = 0.0982 = 9.82% 9.82% is above the 5% significance level Insufficient evidence to reject H0 % of people who bought single packets of crisps has not dropped
At the same supermarket, the manager thinks that the probability of a customer buying a bumper pack of crisps is 0.03. To test whether or not this hypothesis is true the manager decides to take a random sample of 300 customers. (b) Stating your hypotheses clearly, find the critical region to enable the manager to test whether or not there is evidence that the probability is different from 0.03. The significance level should be 5%. S.L. = 2.5% each side np = 9 X ~ B(300, 0.03) Y ~ Po(9) H0 : = 9 H1 : 9 Critical Region Y 3 and Y 16 2.5% 2.5% 9 b a P(Y a) = 0.025 P(Y 3) = 0.0212 P(Y b) = 0.025 P(Y b-1) = 0.975 P(Y 14) = 0.9585 P(Y 15) = 0.9780 P(Y 4) = 0.0550
(c) Write down the significance level of this test. Critical Region X 3 and X 16 2.5% 2.5% 9 b a P(Y a) = 0.025 P(Y 3) = 0.0212 P(Y b) = 0.025 P(Y b-1) = 0.975 P(Y 14) = 0.9585 P(Y 15) = 0.9780 P(Y 4) = 0.0550 SIGNIFICANCE LEVEL = 0.0212 + (1 0.9780) = 0.0432 = 4.32%
A standard treatment for a drug has a probability of success of 0.3. A doctor has done some research and has modified the drug and tested it on 20 patients. He wants to see whether the modified drug has changed the success rate. (a) Find the critical region where the significance level needs to be as close to 5% as possible. (b) What is the significance level? (c) 9 patients had success with the modified drug. At the 5% level of significance, does this give evidence that the drug has improved the success rate? (d) On a larger trial using 500 patients, 162 patients had success with the modified drug. Test at the 2.5% significance level as to whether there evidence to suggest the drug has improved the success rate?
A standard treatment for a drug has a probability of success of 0.3. A doctor has done some research and has modified the drug and tested it on 20 patients. He wants to see whether the modified drug has changed the success rate. (a) Find the critical region where the significance level needs to be as close to 5% as possible. H0 : p = 0.3 H1: p 0.3 X ~ B(20, 0.3) S.L.: 2.5% each side P(X a) = 0.025 P(X 2) = 0.0355 P(X b-1) = 0.975 P(X 10) = 0.9829 Critical Region: X 2 and X 11 (b) What is the significance level? Significance Level = 0.0355 + (1 0.9829) = 0.0526 = 5.26%
(c) 9 patients had success with the modified drug. At the 5% level of significance, does this give evidence that the drug has improved the success rate? Critical Region: X 2 and X 11 9 is OUTSIDE the critical region Insufficient evidence to reject H0 Drug has not improved success rate (d) On a larger trial using 500 patients, 162 patients had success with the modified drug. Test at the 2.5% significance level as to whether there evidence to suggest the drug has improved the success rate? X ~ B(500, 0.3) np = 150 S.L. = 2.5% one tailed P(X 162) P(Y > 161.5) = ? ? >???.? ??? np(1 p) = 105 H1 : p > 0.3 Y ~ N(150, 105) H0 : p = 0.3 = ? ? > ?.?? ??? = ? ?(?.??) = ? ?.???? = ?.???? = ??.??% 13.14% is greater than 2.5%, insufficient evidence to reject H0. The drug has not improved the success rate


")


 Write down the significance level of this test.")


 9 patients had success with the modified drug. At the")