Hypothesis Tests in Statistics: Introduction and Procedures
Explore the fundamentals of hypothesis testing in statistics, including two procedures - critical-value and p-value approaches. Understand the concepts of null and alternative hypotheses, types of errors, and significance levels. Dive into various types of hypothesis tests such as two-tailed, left-tailed, and right-tailed tests, with practical examples. Learn about known standard deviation cases and the conditions for conducting hypothesis tests. Enhance your understanding of statistical analysis in decision-making processes.

Download Presentation

Please find below an Image/Link to download the presentation.
The content on the website is provided AS IS for your information and personal use only. It may not be sold, licensed, or shared on other websites without obtaining consent from the author. If you encounter any issues during the download, it is possible that the publisher has removed the file from their server.
You are allowed to download the files provided on this website for personal or commercial use, subject to the condition that they are used lawfully. All files are the property of their respective owners.
The content on the website is provided AS IS for your information and personal use only. It may not be sold, licensed, or shared on other websites without obtaining consent from the author.
E N D
Presentation Transcript
Statistics Session 22-23 Hypothesis Tests: Introduction and About the Mean, Known Standard Deviation Ezra Halleck, City Tech (CUNY), Fall 2021
Two Procedures Two procedures to make tests of hypothesis 1. Critical-value approach 2. P-value approach 2
Review of 9.1 Two Hypotheses Two Types of Errors Rejection and Nonrejection Regions, Tails of a Test 3
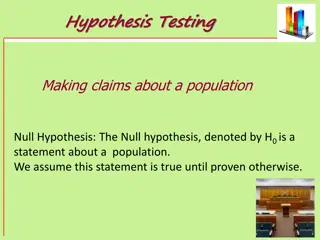
Two Hypotheses Definition H0, the null hypothesis: a claim (or statement) about a population parameter that is assumed to be true until it is declared false. Ha, the alternative hypothesis: a claim about a population parameter that is declared true if H0 is declared to be false [otherwise, its truth is left undetermined].* *In a criminal trial, a person who is not declared guilty is not declared to be simultaneously innocent. (Although oftentimes, this subtlety gets lost in the media and public.) 4
Figure 9.2 A Two-Tailed Test Has the average salary changed? 5
A Left-Tailed Test: Is the soft-drink company filling the cans adequately? 6
A Right-Tailed Test Has the average price of a home increased? 7
Table 9.3 Signs in H0 and H1 and Tails of a Test Two-Tailed Test Left-Tailed Test Right-Tailed Test Blank Equal to or greater than or equal to or = Equal to or less than or equal to or = Sign in (he null hypothesis H0 Sign in the alternative hypothesis H1 = Not equal to < > Rejection region In both tails In the left tail In the right tail 8
9.2 Hypothesis Tests About ? : ? Known Three Possible Cases Case I. If the following three conditions are fulfilled: 1. The population standard deviation is known 2. The sample size is small (i.e., n < 30) 3. The population from which the sample is selected is normally distributed. 9
Hypothesis Tests About ? : ? Known(1 of 4) Three Possible Cases Case II. If the following two conditions are fulfilled: 1. The population standard deviation is known 2. The sample size is large ( ) n i.e., 30 10
Hypothesis Tests About ? : ? Known(2 of 4) Three Possible Cases Case III. If the following three conditions are fulfilled: 1. The population standard deviation is known 2. The sample size is small (i.e., n < 30) 3. The population from which the sample is selected is not normally distributed (or its distribution is unknown). 11
Hypothesis Tests About ? : ? Known(3 of 4) Three Possible Cases 12
Hypothesis Tests About ? : ? Known(5 of 6) Test Statistic In tests of hypotheses about using the normal distribution, the random variable x = = z where x n x is called the test statistic. The test statistic can be defined as a rule or criterion that is used to make the decision whether or not to reject the null hypothesis. 13
Hypothesis Tests About ? : ? Known Steps to Perform a Test of Hypothesis with the Critical Value Approach 1. State the null and alternative hypotheses. 2. Select the distribution to use. 3. Determine the rejection and nonrejection regions. 4. Calculate the value of the test statistic. 5. Make a decision. 14
Has the length of calls changed? ITT provides long-distance telephone service in an area. According to the company s records, the average length of all long-distance calls placed through this company in 2015 was 12.44 minutes with a standard deviation of 2.65 minutes. The company wants to check if the mean length of the current long-distance calls is different from 12.44 minutes . A sample of 150 such calls placed through this company produced a mean length of 13.71 minutes. Using the 2% significance level and assuming the same standard deviation, can we conclude that the mean length of all current long-distance calls is different from 12.44 minutes? 15
Call length solution Step 1: = .02 = : 12.44 : 12.44 H H 0 1 The key phrase different from translates into a 2-tail test. Step 2:The population standard deviation is known, and the sample size is large (n > 30). Due to the Central Limit Theorem, we use the normal distribution to perform the test. Step 3: Area in each ta 2 .02 2 = = = il . 1 0 The zvalues for the two critical points are 2.33 and 2.33. 16
Calculating the Value of the Test Statistic When using the normal distribution, statistic z for x for a test of hypothesis about is computed as follows: x = = z where x n x The value of z for x is also called the observed value of z. 18
Call length solution (cont) Step 4: Find the standard error and test statistic: = = = 150 13.71 12.44 .21637159 x 2.65 .21637159 x n x = = z = 5.87 Step 5: A test statistic of z = 5.87 is greater than the critical value of z= 2.33, so it falls in the rejection region in the right tail. Hence, we reject H0 and conclude that the mean length of long-distance calls is no longer 12.44 minutes. 19
Call length solution (cont) ?????= 5.87 20
Net worth in a middle-class neighborhood Net worth is the value of all the non-financial and financial assets owned by an individual or institution minus the value of all its outstanding liabilities. The mayor of a large city claims that the average net worth of families living in a middle-class neighborhood is at least $300,000. A random sample of 25 families selected from the neighborhood produced a mean net worth of $288,000. Suppose the net worths of all families in this neighborhood has a normal distribution with standard deviation $80,000. Using the 2.5% significance level, can you conclude that the mayor s claim is false? 21
Net worth in a middle-class neighborhood (cont) Step 1: : $300,000 : $300,000 H H 0 1 Step 2:The population standard deviation is known, the sample size is small (n < 30), but the population distribution is normal. Consequently, we will use the normal distribution to perform the test. Step 3: = .025 The < sign in the alternative hypothesis indicates that the test is left-tailed. Area in the left tail The critical value of zis 1.96. = = .025. 22
Net worth in a middle-class neighborhood (cont) Step 4: = = 25 288 000 16,000 x Step 5: This value of z = .75 is greater than the critical value of z= 1.96, and it falls in the nonrejection region. As a result, we fail to reject H0. Therefore, we do not enough evidence to be able to reject the mayor s statement. In other words, the net worth of families in this neighborhood may indeed by larger than 300,000. 80,000 = $16,000 x n x 300,000 , = = = z .75 24
Net worth in a middle-class neighborhood (cont) ?????= -0.75 25


")
")
")
")


")

")
")

")
")
")
")