Identifying Chemical Compounds with Quadratic Peaks in Fluorescence Data
Explore the use of quadratic peaks in fluorescence data to identify chemical compounds. Learn about the yellowing problem in wool processing and the application of fluorescent spectroscopy. Understand the basic model, model selection for fluorophores, and the analysis of 20 fluorophores with available parameters.

Download Presentation

Please find below an Image/Link to download the presentation.
The content on the website is provided AS IS for your information and personal use only. It may not be sold, licensed, or shared on other websites without obtaining consent from the author. If you encounter any issues during the download, it is possible that the publisher has removed the file from their server.
You are allowed to download the files provided on this website for personal or commercial use, subject to the condition that they are used lawfully. All files are the property of their respective owners.
The content on the website is provided AS IS for your information and personal use only. It may not be sold, licensed, or shared on other websites without obtaining consent from the author.
E N D
Presentation Transcript
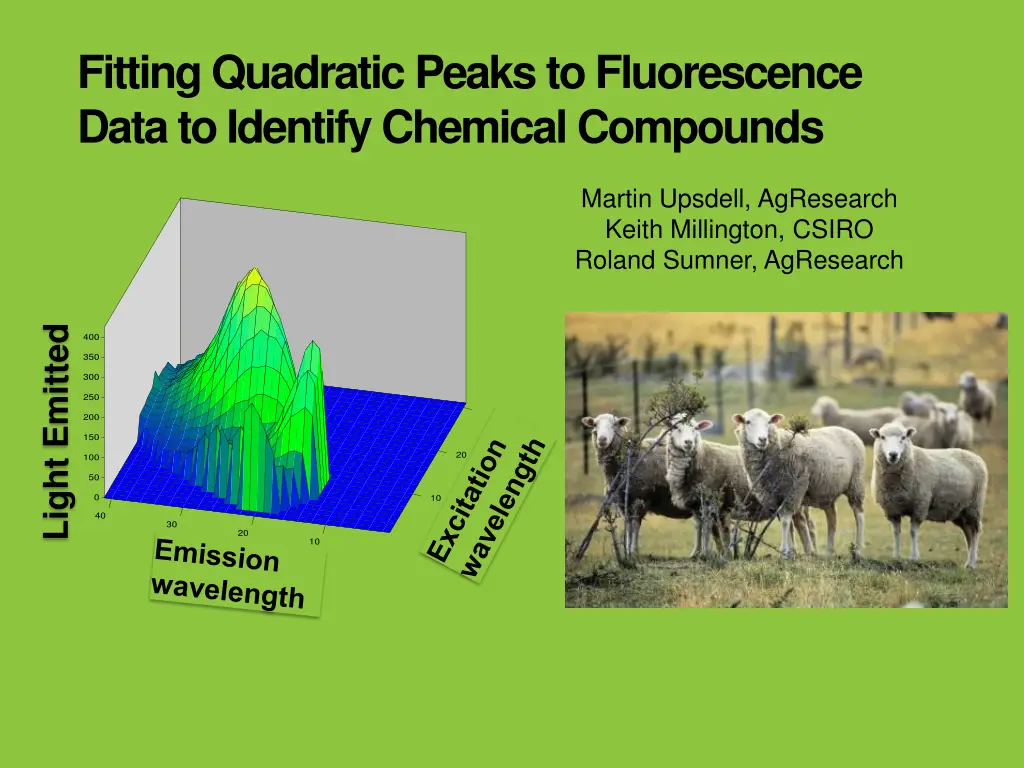
Fitting Quadratic Peaks to Fluorescence Data to Identify Chemical Compounds Martin Upsdell, AgResearch Keith Millington, CSIRO Roland Sumner, AgResearch Light Emitted 400 350 300 Z axis 250 30 200 150 20 100 Y axis 50 0 10 40 30 20 10 X axis
The Yellowing Problem Develops in the fleece Most severe in lower regions of the fleece Increases with moisture, warmth, high pH Unscourable The most serious fault in wool processing Affects the appearance of dyed wool Chromophores are protein degradation products
Size of Data Wool Samples Spectral points Number of data points 108 468 Spectral Points 50,544 Emission Wavelength (nm) 600 500 400 300 400 500 Excitation Wavelength (nm)
Basic Model Linear regression for each sample Where ? ??EM= Light intensity from sample ? ??? = Amount of fluorophore ? in sample ? ??? 0 E = Excitation wavelength M = Emission wavelength ????= ??+ ???Peak? ?=1 Non linear part for each peak Peak? is quadratic with 5 parameters on an elliptical base Peak? 2 2 E ?? ?? M ?? ?? 2?E ?? M ?? ?? + ?? 1 = ??? 1 ?2 0
Size of Model Number of Fluorophores Nonlinear parameters Possible linear parameters Less when fluorophore absent ? 5? 108 1 + ? ?
Model Selection: How Many Fluorophores? large ? =50,543 Bayesian Information Criteria ??? = 2log ? + ?log(?) Quadratic Peak What is ?? 50,544? Item Spectral points within peak Samples with peak Sample points / peak Points / Amount Maximum Number Range with 20 peaks 6 -> 468 79 -> 108 647 -> 43,991 6 -> 468 468 108 50,544 468 ? ??? ? ??? = ???? ? + ??? ?? ?=?
20 Fluorophores! Parameters: 2368 available; 2271 used; 2171 linear; 100 nonlinear
20 Fluorophores (A to T) Reader effects? Splitting peaks? Outliers?
Are the Fluorophores Influential ? E A C D B 8 10 12 14 16 18 8 10 12 14 16 18 8 10 12 14 16 18 8 10 12 14 16 18 8 10 12 14 16 18 I H G Fluoresence F K 8 10 12 14 16 18 8 10 12 14 16 18 8 10 12 14 16 18 8 10 12 14 16 18 8 10 12 14 P 16 18 L M N O 8 10 12 14 16 18 8 10 12 14 16 18 8 10 12 14 16 18 8 10 12 14 16 U 18 8 10 12 14 16 18 V R S T 8 10 12 14 16 18 8 10 12 14 16 18 8 10 12 14 16 18 8 10 12 14 16 18 8 10 12 14 16 18 Yellowing (Y-Z)
Conclusions Fitting quadratic peaks to all samples simultaneously finds many more fluorophores than the eye can see The number of data points used to estimate parameters varies Only points with ? 0 should be counted in computing BIC Total BIC = the sum of individual BICs
Excitation Width Emission Width Hill N Obs N Sample N Points Excitation Emission Correlation 1 105 201 409 496 104 88 0.59 21,105 2 108 121 380 447 74 82 0.72 13,068 3 106 184 147 505 246 151 -0.75 19,503 4 108 6 168 346 62 104 0.77 647 5 108 26 285 292 35 92 -0.23 2,808 6 108 276 368 513 80 136 0.40 29,808 7 108 158 491 495 119 206 -0.11 17,064 8 108 85 194 476 90 204 -0.28 9,179 9 108 102 386 402 83 104 -0.61 11,016 10 108 174 272 323 147 216 0.92 18,792 11 100 155 291 395 83 186 0.90 15,500 12 108 14 227 398 18 95 0.87 1,512 13 108 14 295 350 10 51 0.05 1,512 14 98 99 398 435 69 99 -0.56 9,702 15 79 182 530 534 236 71 0.27 14,378 16 96 104 362 397 49 140 -0.46 9,984 17 94 468 332 545 213 265 0.25 43,991 18 108 47 371 527 28 57 0.18 5,076 19 98 144 418 474 63 112 -0.09 14,112 20 99 33 439 441 72 44 -0.12 3,267


")