Identifying Subclasses of Depression with Latent Class Analysis
Explore how Latent Class Analysis is used to identify subclasses of depression, aiming to improve the diagnosis of depression severity. The study compares the results with the PHQ-9 measures and delves into data preparation and methodology for the analysis.
Download Presentation

Please find below an Image/Link to download the presentation.
The content on the website is provided AS IS for your information and personal use only. It may not be sold, licensed, or shared on other websites without obtaining consent from the author. If you encounter any issues during the download, it is possible that the publisher has removed the file from their server.
You are allowed to download the files provided on this website for personal or commercial use, subject to the condition that they are used lawfully. All files are the property of their respective owners.
The content on the website is provided AS IS for your information and personal use only. It may not be sold, licensed, or shared on other websites without obtaining consent from the author.
E N D
Presentation Transcript
THE USE OF LATENT CLASS ANALYSIS FOR IDENTIFYING SUBCLASSES OF DEPRESSION USING JMP PRO Authors: Tin Seong KAM, Karishma YADAV, Sue-Ann SEET, Yi Ying TAN
INTRODUCTION According to WHO, Depression is a leading cause of disability worldwide and is a major contributor to the overall global burden of disease . A major stumbling block in the care of depressed patients remains the accurate diagnosis of the severity of depression.[1]
PROBLEM STATEMENT From a clinical standpoint, PHQ-9 has been assessed to be a valid instrument of measuring severity of depression.[1] TOTAL SCORE A 10 0 B 10 3 C 20 2 D 20 3 2 0 3 3 3 3 1 3 3 0 2 3 2 0 3 3 0 1 2 0 0 0 3 2 0 3 1 3 0 0 3 0 However, from a statistical analysis point of view, the PHQ-9 scoring system appears to be too simplistic to diagnose for depression in a population.
OBJECTIVE Using the same set of 9 questions, Run latent class analysis to generate optimal clusters. Extract the clusters which exhibit severe depression symptoms among data population. Compare the cluster analysis results with the PHQ-9 measures.
DATA PREPARATION Dataset imported into JMP Pro 16 Data inclusion & exclusion Data Cleaning & Transformation Model NHANES 2017- 2018 Mental Mental Health - Depression Screener (DPQ_J) Total number of records : 5,533 Contained 10 columns Original data contained 10 questions; excluded the last question as it is a question to consolidate the questionnaire which asked, How difficult have these problems made it for you to do your work, take care of things at home, or get along with people? Check for missing values Rename columns to better reflect the variables Calculate the score of PHQ-9 (summing all 9 question response values) & recode into categorical classes of depression severity Run latent class analysis on prepared data
METHODOLOGY 5. Contingency table analysis was carried out to compare LCA clusters to the 5- categories of depression severity classes derived using PHQ-9. 6. Hypothesis Testing: PHQ-9 method based on the sum of responses is overly subjective, as it does not consider the statistical weightage of individual variables. 3. Effect sizes and log worth of respective variables were evaluated to identify the separation between latent classes. 1. Conduct latent class analysis (LCA) using JMP Pro 16 to group the individuals with distinct patterns into clusters. 2. The best clustering model was selected based (smallest) BIC and AIC values.
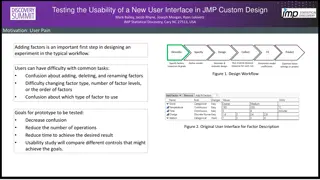
LATENT CLASS ANALYSIS IN JMP PRO Input Variables Cumulative sum of the 9 input variables (range 0 27), makes up PHQ-9 score Classes Based on the cut points identified on the PHQ-9 Score Number of Cluster Classes the model was run for LCA model in JMP Pro
RESULT OF LCA The smallest AIC could not be achieved on this dataset (the AIC gets smaller as the number of clusters increases), Cluster 5 that had the smallest BIC was found to be the optimal cluster size. Result of latent class analysis
PARAMETER ESTIMATES Classes and response probabilities
CLASS DESCRIPTIONS Classes Description 1 - None Class Size: 48.26% Individuals in this group do not experience any depressive symptoms at all. No risk of experiencing depression. 2 - Mild Class Size: 24.37% Have trouble sleeping or sleep too much several days in a week and feel tired or have little energy several days in a week are the two major responses in this class. 3 - Moderate Class Size: 11.23% Majority (71%) in this group feel tired or have little energy at least several days a week. More than half in this group feel tired more than half the week or daily. 4 - Moderately Severe Class size:10.44%. This group of individuals has 7 out of 9 of the depressive symptoms. Individuals in this class experience several days in a week (50-80%) the same symptoms experienced by the individuals of Group 3. Additional responses include feel bad about themselves and have trouble concentrate on things several days a week . 5 - Severe Class size: 5.70%. The individuals in this class experience the all 9 symptoms with higher frequency than the ones in moderately severe class- nearly every day or more than half the days
EFFECT SIZES OF THE 9 VARIABLES Effect size and Log Worth of each variable
CONCLUSION Depression severity levels derived using statistical clustering models like LCA will provide more accurate assessment of depression severity compared to those derived using mere summation of responses of the PHQ-9. Further studies need to be done to determine the weightage of the respective variables to strengthen the PHQ-9 model that has proved to be reliable and efficient.


