IEEE 802.11-15/1316-03-00ax DSC Calibration Results with NS-3
Explore the calibration results of spatial reuse implementation in NS-3, comparing findings with existing simulation tools. Detailed insights on simulation environment, scenarios, path loss model, and throughput calibration provided by authors from Technical University of Catalonia.

Uploaded on | 2 Views
Download Presentation

Please find below an Image/Link to download the presentation.
The content on the website is provided AS IS for your information and personal use only. It may not be sold, licensed, or shared on other websites without obtaining consent from the author. If you encounter any issues during the download, it is possible that the publisher has removed the file from their server.
You are allowed to download the files provided on this website for personal or commercial use, subject to the condition that they are used lawfully. All files are the property of their respective owners.
The content on the website is provided AS IS for your information and personal use only. It may not be sold, licensed, or shared on other websites without obtaining consent from the author.
E N D
Presentation Transcript
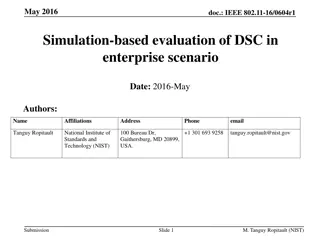
Nov. 2015 doc.: IEEE 802. 11-15/1316-03-00ax DSC calibration results with NS-3 Authors: Name M. Shahwaiz Afaqui Affiliations Technical University of Catalonia (UPC) Address Edifici C4 Despatx 323 C/ Esteve Terrades, 7 08860 Castelldefels, Barcelona, Spain. Edifici C4 Despatx 322 C/ Esteve Terrades, 7 08860 Castelldefels, Barcelona, Spain. email shahwaiz.afaqui@entel.upc.edu Eduard Garcia- Villegas Technical University of Catalonia (UPC) eduardg@entel.upc.edu Elena Lopez- Aguilera Technical University of Catalonia (UPC) Edifici C4 Despatx 303 C/ Esteve Terrades, 7 08860 Castelldefels, Barcelona, Spain. elopez@entel.upc.edu M. Shahwaiz Afaqui Submission
Nov. 2015 doc.: IEEE 802. 11-15/1316-03-00ax Outline 1. Context 2. Simulation Environment: NS-3 3. Simulation scenarios and assumptions 4. Path loss model calibration 5. Throughput calibration Results 6. Conclusions 7. References M. Shahwaiz Afaqui Submission Slide 2
Nov. 2015 doc.: IEEE 802. 11-15/1316-03-00ax 1. Context As highlighted in [1], many simulation results have been presented by TGax, However, results are inconsistent due to diverse conditions. In addition, there is a need to perform apples-to-apples comparison so that different simulation tools could be calibrated based on a reference model. In this submission we, Present the calibration results of our spatial reuse implementation in NS-3, By utilizing the simple scenario presented in [1] We compare our findings with the results presented in [2] and [3] M. Shahwaiz Afaqui Submission Slide 3
Nov. 2015 doc.: IEEE 802. 11-15/1316-03-00ax 2. Simulation Environment: NS-3 NS-3 Allows the study of protocols and network performance of large-scale systems in a controlled and scalable environment. Main characteristics, Discrete event simulator Packet level simulator (layer 2 and above) Layered architecture Simplified PHY layer abstraction Free and open source Frequent updates ( latest version ns 3.24- release date Sept. 15th, 2015) Large number of protocol implementations and models available, TCP, UDP IPV4, IPV6, static routing IEEE 802.11 and variants, WiMAX, LTE IEEE 802 physical layer Mobility models and routing protocols Ability to design indoor, outdoor or hybrid networks etc. M. Shahwaiz Afaqui Submission Slide 4
Nov. 2015 doc.: IEEE 802. 11-15/1316-03-00ax 3. Simulation scenarios and assumptions (1/4) Topology (from [1]) Two BSS separated with a distance of 30m, 2 stations associated with each AP AP and stations placed at 1.5m height. STA1 STA2 3m 3m 30m AP1 AP2 STA4 STA3 M. Shahwaiz Afaqui Submission Slide 5
Nov. 2015 doc.: IEEE 802. 11-15/1316-03-00ax 3. Simulation scenarios and assumptions (2/4) Frequency band: 5GHz, Traffic: UDP CBR uplink transmission in saturation conditions is considered, Worst case in terms of contention. Pathloss model: ThreeLogDistancePropogationLossModel [4], A log distance path loss propagation model with three distance fields (i.e. near, middle and far) with different exponents. Within each field the reception power is calculated using the log-distance propagation equation: ? = ?? + 10 no log10(? ??) (see details on next slide) Extra loss due to shadowing and fading are not considered Following [1]. The simulation time used was 30 seconds, Start time was after 5 seconds M. Shahwaiz Afaqui Submission Slide 6
Nov. 2015 doc.: IEEE 802. 11-15/1316-03-00ax 3. Simulation scenarios and assumptions (3/4) Physical layer parameters Parameter Band Width Value All BSSs at 5GHz (Ch 36, 5180) [80MHz, no dynamic bandwidth] Shadow fading Data preamble STA TX Power AP TX Power No shadowing IEEE 802.11ac VHT 15-10 dBm 20-15 dBm 1/1 1/1 0 dBi -2 dBi 400ns (short guard interval) -56/-66/-76 dBm @ 80MHz -56 dBm Fixed MCS = 5 (234.0 Mbps) ideal d0 = 1, d1=10, d2=30, e0=2, e1=3.5, e2=3.5 AP number of TX/RX antennas STA number of TX /RX antennas AP antenna gain STA antenna gain Guard interval CCA threshold CCA-ED Link Adaptation Channel estimation Pathloss Model parameters M. Shahwaiz Afaqui Submission Slide 7
Nov. 2015 doc.: IEEE 802. 11-15/1316-03-00ax 3. Simulation scenarios and assumptions (4/4) MAC layer parameters Parameter Access protocol Value [EDCA, AC_BE with default parameters] [CWmin = 15, CWmax = 1023, AIFSn=3 ] UDP CBR with rate 200Mbps Uplink only 1538 Bytes (1472 Data + 28 IP header + 8 bytes LLC + 30 MAC header) 32 MPDUs with Block Ack. 10 Disabled Off Per non-AP station (received bits/overall simulation time), measured using flowmonitors [5] Simulation parameters Traffic type Traffic direction MPDU size Aggregation Max number of retries Beacons RTS/CTS Throughput Parameter Simulation time Value 30 seconds M. Shahwaiz Afaqui Submission Slide 8
Nov. 2015 doc.: IEEE 802. 11-15/1316-03-00ax 4. Path loss model calibration NS-3 MTK [2] Path loss model used in NS-3 simulator, where black squares indicate the received power reported in key locations M. Shahwaiz Afaqui Submission Slide 9
Nov. 2015 doc.: IEEE 802. 11-15/1316-03-00ax 5. Calibration Results (1/5) TX PWR STA = 15, TX PWR AP = 20 We compare the results with [2] in which the authors used 5dB of shadowing. MTK Throughput (Mbps) 50.35 51.65 51.10 50.41 99.57 99.46 99.54 99.59 99.83 99.80 99.82 99.81 NS-3 Throughput (Mbps) 51.50 49.22 49.29 50.56 50.76 52.05 52.77 52.41 99.29 102.41 101.29 100.14 CCAthr. (dBm) STA1 STA2 STA3 STA4 STA1 STA2 STA3 STA4 STA1 STA2 STA3 STA4 BSS1 -76 (~1,4%) BSS2 BSS1 -66 (~47,8%) BSS2 BSS1 -56 (~1,0%) BSS2 M. Shahwaiz Afaqui Submission Slide 10
Nov. 2015 doc.: IEEE 802. 11-15/1316-03-00ax 5. Calibration Results (2/5) TX PWR STA = 15, TX PWR AP = 20 We compare the results with [2] in which the authors used 5dB of shadowing. MTK Throughput (Mbps) 50.35 51.65 51.10 50.41 99.57 99.46 99.54 99.59 99.83 99.80 99.82 99.81 NS-3 Throughput (Mbps) 51.50 49.22 49.29 50.56 CCAthr. (dBm) STA1 STA2 STA3 STA4 STA1 STA2 STA3 STA4 STA1 STA2 STA3 STA4 BSS1 -76 (~1,4%) BSS2 97.87 98.54 97.60 98.42 99.29 102.41 101.29 100.14 BSS1 increased 4dB -62 (~1,4%) BSS2 BSS1 -56 (~1,0%) BSS2 M. Shahwaiz Afaqui Submission Slide 11
Nov. 2015 doc.: IEEE 802. 11-15/1316-03-00ax 5. Calibration Results (3/5) Reduce TX PWR 4dB: STA = 11, TX PWR AP = 16. We compare the results with [2] in which the authors used 5dB of shadowing. NS-3 (reduced TX PWR) Throughput (Mbps) 51.74 50.60 48.10 49.50 97.05 98.88 97.16 98.32 MTK Throughput (Mbps) CCAthr. (dBm) STA1 STA2 STA3 STA4 STA1 STA2 STA3 STA4 STA1 STA2 STA3 STA4 50.35 51.65 51.10 50.41 99.57 99.46 99.54 99.59 99.83 99.80 99.82 99.81 BSS1 -76 (~1.8%) BSS2 BSS1 -66 (~1.7%) BSS2 100.52 101.58 99.46 99.91 BSS1 -56 (~0.5%) BSS2 M. Shahwaiz Afaqui Submission Slide 12
Nov. 2015 doc.: IEEE 802. 11-15/1316-03-00ax 5. Calibration Results (4/5) Reduce TX PWR 5dB: STA = 10, TX PWR AP = 15. We compare the results with [2] in which the authors used 5dB of shadowing. NS-3 (reduced TX PWR) Throughput (Mbps) 49.02 50.37 49.48 49.99 98.12 98.52 100.90 96.67 100.68 100.55 100.73 100.39 MTK Throughput (Mbps) CCAthr. (dBm) STA1 STA2 STA3 STA4 STA1 STA2 STA3 STA4 STA1 STA2 STA3 STA4 50.35 51.65 51.10 50.41 99.57 99.46 99.54 99.59 99.83 99.80 99.82 99.81 BSS1 -76 (~2.3%) BSS2 BSS1 -66 (~1.0%) BSS2 BSS1 -56 (~0.8%) BSS2 M. Shahwaiz Afaqui Submission Slide 13
doc.: IEEE 802. 11-15/1316-03-00ax 5. Calibration Results (5/5) Nokia* UPC+ 53.76 53.29 107.05 100.72 54.63 54.12 108.75 99.85 215.79 200.57 94.67 95.22 189.89 196.41 95.19 95.00 190.19 196.02 380.08 392.43 1.76 94.82 95.39 102.41 190.21 201.70 95.17 101.29 94.97 100.14 190.14 201.43 380.35 403.13 1.76 CCA-SD Sony* 51.06 51.74 102.80 50.53 51.40 101.93 204.73 93.24 94.28 187.52 93.03 93.93 186.96 374.48 1.83 95.26 96.13 193.22 95.62 95.54 191.16 384.38 1.88 WILUS* 54.09 53.00 107.09 54.51 54.36 108.87 215.96 95.22 96.31 191.53 95.12 95.93 191.05 382.58 1.77 95.70 95.43 191.13 95.51 96.71 192.22 383.35 1.78 NTT* 48.70 48.80 97.50 47.80 48.20 96.00 193.50 93.00 93.50 186.50 93.60 93.10 186.70 373.20 1.93 93.00 93.40 186.40 93.60 93.10 186.70 373.10 1.93 SRTech* 43.30 47.00 90.30 43.30 43.10 86.40 176.70 93.00 94.00 187.00 94.40 92.70 187.10 374.10 2.12 93.00 94.00 187.00 94.40 92.70 187.10 374.10 2.12 BCM* 67.59 66.42 134.01 66.53 68.19 134.72 268.73 85.22 84.33 169.55 84.77 85.00 169.77 339.32 1.26 87.80 86.33 174.13 87.01 87.37 174.38 348.51 1.30 LGE* 67.81 68.99 136.80 68.46 68.22 136.68 273.48 93.99 92.27 186.26 92.83 91.98 184.81 371.07 1.36 94.58 92.20 186.78 93.10 92.33 185.43 372.21 1.36 MTK* 49.18 49.53 98.71 52.01 53.82 105.83 204.54 100.13 100.51 200.64 100.75 100.20 200.95 401.59 1.96 100.79 100.76 201.55 101.12 100.68 201.80 403.35 1.97 STA1 STA2 Total STA3 STA4 Total 51.50 49.22 BSS1 -76 49.29 50.56 BSS2 BSS1 + BSS2 STA1 STA2 Total STA3 STA4 Total 97.87 98.54 BSS1 97.6 98.42 -66 BSS2 BSS1 + BSS2 Gain 1.95 99.29 STA1 STA2 Total STA3 STA4 Total BSS1 -56 BSS2 BSS1 + BSS2 Gain 2.01 * The simulation results are from individual contributors, company names are used only for convenience + Calibration shown in slide 11 is applied M. Shahwaiz Afaqui Submission Slide 14
Nov. 2015 doc.: IEEE 802. 11-15/1316-03-00ax 6. Conclusions In this presentation, we provide the spatial reuse calibration results of our NS-3 simulator based on 15/0652r1 A-MPDU implementation is unstable in really dense scenarios (due to OBSS interference) and needs work. Results indicate consistency with the results presented in [2] and [3]. Calibration needed at cell edges M. Shahwaiz Afaqui Submission Slide 15
Nov. 2015 doc.: IEEE 802. 11-15/1316-03-00ax 7. References [1]. Masahito Mori, IEEE 802.11-15-0652r1, Reference simulation model for Dynamic CCA/DSC calibration. [2]. Chinghwa Yu, IEEE 802.11-15-0886r0, DSC calibration results. [3]. 11-15/801r1, DCCA/DSC Reference Simulation Results [4]. ThreeLogDistancePropagationLossModel Class : ns-3 design document. [Online]. https://www.nsnam.org/doxygen/classns3_1_1_three_log_distance_propagation_loss_model.html Available: M. Shahwaiz Afaqui Submission Slide 16