IEEE 802.11-15 MAC Calibration Results 2015 Analysis
"Explore simulation results for test cases 1-3 in the IEEE 802.11-15 MAC Calibration study conducted in September 2015. Results are compared with previous contributions, showing strong alignment. Gain insights into MAC overhead without RTS/CTS, parameter settings, throughput analysis, and more."

Download Presentation

Please find below an Image/Link to download the presentation.
The content on the website is provided AS IS for your information and personal use only. It may not be sold, licensed, or shared on other websites without obtaining consent from the author. If you encounter any issues during the download, it is possible that the publisher has removed the file from their server.
You are allowed to download the files provided on this website for personal or commercial use, subject to the condition that they are used lawfully. All files are the property of their respective owners.
The content on the website is provided AS IS for your information and personal use only. It may not be sold, licensed, or shared on other websites without obtaining consent from the author.
E N D
Presentation Transcript
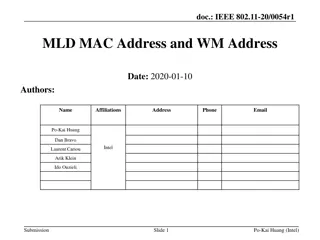
doc.: IEEE 802.11-15/1046r0 September 2015 MAC Calibration Results Date: 2015-09 Authors: Name Affiliation Address Email stephane.baron@crf.canon.fr St phane BARON Cesson-Sevign , France patrice.nezou@crf.canon.fr Patrice NEZOU Canon romain.guignard@crf.canon.fr Romain GUIGNARD pascal.viger@crf.canon.fr Pascal VIGER Slide 1 Submission St phane Baron et al., Canon
doc.: IEEE 802.11-15/1046r0 September 2015 Abstract This contribution summarizes our simulation results for test cases 1-3 according to 802.11ax Simulation Scenarios document (11-14-0980-12) and Evaluation Methodology (11-14-0571-9) The results are obtained through 11 runs. Each run lasts 600 seconds. The results are compared with previous contributions and match pretty well with previous simulation results Submission Slide 2 St phane Baron et al., Canon
doc.: IEEE 802.11-15/1046r0 September 2015 Test 1a: MAC overhead without RTS/CTS Parameter settings MSDU length: [0:500:2000Bytes] 2 MPDU limit RTS/CTS off Data MCS = [0,8] RTS/CTS MCS = 0 ACK MCS = 0 AIFS=DIFS=34us STA 1 AP1 D = 1m MCS0 MCS8 MSDU Length (Bytes) 500 1000 1500 2000 500 1000 1500 2000 THROUGHPUT (Mbps) Application Throughput Mean Throughput (for 18 other companies) Deviation Mean Deviation (for 18 other companies) DURATION A-MPDU Duration SIFS Duration ACK Duration Defer & backoff duration 4,79 5,55 5,84 5,99 22 34,93 43,26 48,68 4,7805 0,20% 5,537895 0,22% 5,830526 0,16% 5,984737 0,09% 21,88158 0,54% 34,78842 0,41% 42,94105 0,74% 48,42632 0,52% 0,51% 0,21% 0,17% 0,19% 2,47% 1,54% 1,03% 0,92% OK OK OK OK OK OK OK OK OK OK OK OK OK OK OK OK OK OK OK OK OK OK OK OK OK OK OK OK OK OK OK OK Submission Slide 3 St phane Baron et al., Canon
doc.: IEEE 802.11-15/1046r0 September 2015 Test 1b: MAC overhead with RTS/CTS Parameter settings MSDU length: [0:500:2000Bytes] 2 MPDU limit RTS/CTS on Data MCS = [0,8] RTS/CTS MCS = 0 ACK MCS = 0 AIFS=DIFS=34us STA 1 AP1 D = 1m MCS0 MCS8 MSDU Length (Bytes) 500 1000 1500 2000 500 1000 1500 2000 THROUGHPUT (Mbps) Application Throughput Mean Throughput (for 18 other companies) Deviation Mean Deviation (for 18 other companies) DURATION A-MPDU Duration SIFS Duration ACK Duration Defer & backoff duration 15,95 27,08 34,99 40,62 4,43 5,31 5,66 5,85 4,412421 0,31% 5,293579 0,27% 5,646895 0,25% 5,840105 0,20% 15,85158 0,62% 26,94579 0,50% 34,70947 0,81% 40,43316 0,46% 0,49% 0,29% 0,26% 0,20% 1,40% 0,90% 0,86% 0,84% OK OK OK OK OK OK OK OK OK OK OK OK OK OK OK OK OK OK OK OK OK OK OK OK OK OK OK OK OK OK OK OK Submission Slide 4 St phane Baron et al., Canon
doc.: IEEE 802.11-15/1046r0 September 2015 Test 2a: Deferral Test 1 Parameter settings MSDU length: [0:500:2000Bytes] 2 MPDU limit RTS/CTS [off, on] Data MCS = [0] RTS/CTS MCS = 0 ACK MCS = 0 AIFS=DIFS=34us CWmax = 1023 D = 1m THROUGHPUT (Mbps) MSDU Length (Bytes) MCS0 Application Throughput Mean Throughput (for 18 other companies) Deviation Mean Deviation (for 18 other companies) 500 1000 Without RTS / CTS 5,28 1500 2000 500 1000 With RTS / CTS 5,34 1500 2000 4,6 5,54 5,68 4,47 5,68 5,87 4,594579 5,286316 5,541053 5,684579 4,449789 5,313474 5,663789 5,852579 0,11% 0,12% 0,02% 0,08% 0,45% 0,50% 0,29% 0,30% 1,46% 1,41% 1,55% 1,58% 0,96% 0,68% 0,57% 0,48% Submission Slide 5 St phane Baron et al., Canon
doc.: IEEE 802.11-15/1046r0 September 2015 Test 2b: Deferral Test 2 Parameter settings MSDU length:[1500Bytes] RTS/CTS [ OFF] Data MCS = [0,8] ACK MCS=0 AIFS=DIFS=34us CWmax=1023 2MPDU limit STA 2 AP 2 AP1 STA 1 D = 65m D = 65m THROUGHPUT (Mbps) No FA FA No FA FA MCS0 MCS8 2,29 0,904 28,112 37,484 Application Throughput Mean Throughput (from 18 other companies) 1,74 1,01 26,94 34,42 31,61% 10,64% 4,35% 8,90% Deviation Mean Deviation (from 18 other companies) 12,44% 25,13% 3,67% 8,86% Submission Slide 6 St phane Baron et al., Canon
doc.: IEEE 802.11-15/1046r0 September 2015 Test 3: NAV Deferral Parameter settings MSDU length:[1500Bytes] RTS/CTS [ ON] Data MCS = [0,8] RTS/CTS MCS = 0 ACK MCS=0 AIFS=DIFS=34us CWmax=1023 2MPDU limit STA 2 AP 2 AP1 STA 1 D = 65m D = 65m THROUGHPUT (Mbps) No FA FA No FA FA MCS0 MCS8 5,141 5,602 22,116 34,108 Application Throughput Mean Throughput (from 18 other companies) Deviation Mean Deviation (from 18 other companies) 5,146 5,593 21,817 33,026 0,10% 0,16% 1,37% 3,27% 0,89% 1,95% 3,39% 9,26% Submission Slide 7 St phane Baron et al., Canon
doc.: IEEE 802.11-15/1046r0 September 2015 Test 4: Deferral Test for 20 and 40MHz BSSs Parameter settings MSDU length: 2000Bytes RTS/CTS [off, on] MCS = [0] channel bandwidth: BSS1: 40MHz BSS2: 20MHz (the secondary channel of BSS1) traffic model: BSS1: full buffer BSS2: Poisson distribution with lamda=100 D = 1m Application Length (B) MSDU Length (B) Simulated Application Layer Throughput (Mbps) Simulated MAC Layer Throughput (Mbps) BW mode TX Time (%) 20MHz/40MHz RTS/CTS PER(%) Off Adapt. 1964 2000 2,847 8,719722 8,879554 50,34088 49,65912 Off Fixed 1964 2000 7,769 1,555112 1,583617 100 0 On Adapt. 1964 2000 0,000 8,486177 8,641728 52,88736 47,11263 On Fixed 1964 2000 0,000 1,555450 1,583961 100 0 Submission Slide 8 St phane Baron et al., Canon
doc.: IEEE 802.11-15/1046r0 September 2015 Conclusion MAC calibration simulation results for Tests 1a, 1b, 2a, 2b, 3 and 4 were mostly similar to other contribution results. Submission Slide 9 St phane Baron et al., Canon
doc.: IEEE 802.11-15/1046r0 September 2015 References 1.R. Porat et al, Evaluation Methodology , IEEE 11-14/571r10. 2.S. Merlin et al, Simulation Scenarios , IEEE 11-14/980r14. Submission Slide 10 St phane Baron et al., Canon
doc.: IEEE 802.11-15/1046r0 September 2015 Backup Slides Submission Slide 11 St phane Baron et al., Canon
doc.: IEEE 802.11-15/1046r0 September 2015 Test 1a: MAC overhead w/out RTS/CTS Parameter settings MSDU length: [0:500:2000Bytes] 2 MPDU limit RTS/CTS off Data MCS = [0,8] RTS/CTS MCS = 0 ACK MCS = 0 AIFS=DIFS=34us STA 1 AP1 D = 1m Submission Slide 12 St phane Baron et al., Canon
doc.: IEEE 802.11-15/1046r0 September 2015 Test 1a: Time trace of transmitting/receiving event MSDU Length (B) 500 1000 1500 2000 500 1000 1500 2000 MCS 0 0 0 0 8 8 8 8 CP1: start of A-MPDU (s) 0,000534021 0.000534021 0,000534021 0,000534021 0,000493021 0,000493021 0,000493021 0,000493021 CP2: end of A-MPDU (s) 0,001898024 0.003126024 0.004358024 0.005590024 0,000645024 0,000749024 0,000849024 0,000953024 CP2-CP1 (us) 1364,003 2592,003 3824,003 5056,003 152,003 256,003 356,003 460,003 CP3: start of BA (s) 0.003142024 0.004374024 0.005606024 0,000661024 0,000765024 0,000865024 0,000969024 0.001914024 CP3-CP2 (us) 16 16 16 16 16 16 16 16 CP4: end of BA (s) 0.003210027 0.004442027 0.005674027 0,000729027 0,000833027 0,000933027 0,001037027 0.001982027 CP4-CP3 (us) 68,003 68,003 68,003 68,003 68,003 68,003 68,003 68,003 CP5: start of new A-MPDU (s) 0.003334027 0.004503027 0.005780027 0,000817027 0,000984027 0,000994027 0,001152027 0.002088027 CP5-CP4 (us) (Nb slots) 124 61 106 8 slots 88 151 61 115 9 slots 106 8 slots 10 slots 3 slots 6 slots 13 slots 3 slots Submission Slide 13 St phane Baron et al., Canon
doc.: IEEE 802.11-15/1046r0 September 2015 Test 1a: Check Points Test Items Standard definition Check points (MCS 0) Matching? MSDU Length (B) 500 1000 1500 2000 ceil((FrameLength*8)/rate/OFDMsy mbolduration) * OFDMsymbolduration + PHY Header A-MPDU duration (us) Tcp2 - Tcp1 = 1364us Tcp2 - Tcp1 = 2592us Tcp2 - Tcp1 = 3824us Tcp2 - Tcp1 = 5056us ok SIFS (us) Tcp3 - Tcp2 = 16us Tcp3 - Tcp2 = 16us Tcp3 - Tcp2 = 16us Tcp3 - Tcp2 = 16us ok 16 ceil((ACKFrameLength*8)/rate/OFD Msymbolduration) * OFDMsymbolduration + PHY Header ACK duration (us) Tcp4 - Tcp3 = 68us Tcp4 - Tcp3 = 68us Tcp4 - Tcp3 = 68us Tcp4 - Tcp3 = 68us ok Avg. Defer & backoff duration (us) DIFS(34 us)+backoff (CWmin) =34+n*9/2 Tcp5 - Tcp4 = 101.5us Tcp5 - Tcp4 = 101.5us Tcp5 - Tcp4 = 101.5us Tcp5 - Tcp4 = 101.5us ok Submission Slide 14 St phane Baron et al., Canon
doc.: IEEE 802.11-15/1046r0 September 2015 Test 1a: Throughput Results Application data size, [Bytes] MSDU size, [Bytes] Numerical MAC Throughput, [Mbit/s] Simulated MAC Throughput, [Mbit/s] MCS index Numerical L4 Throughput, [Mbit/s] Simulated L4 Throughput, [Mbit/s] 0 464 500 4.79112 5.16296 4,79111 5,16284 0 964 1000 5.55320 5,55318 5.76058 5,76056 0 1464 1500 5.84212 5.98578 5,84215 5,98581 0 1964 2000 5.99523 6.10512 5,99518 6,10507 8 464 500 21.99704 23.70370 21,99578 23,70235 8 964 1000 34.93545 36.24009 34,93368 36,23826 8 1464 1500 43.25762 44.32133 43,25773 44,32144 8 1964 2000 48.68164 49.57397 48,68053 49,57284 Submission Slide 15 St phane Baron et al., Canon
doc.: IEEE 802.11-15/1046r0 September 2015 Test 1a: Application Throughput Comparison (Mbps) Company Contribution # MCS0 (6.5Mbps) MCS8 (78Mbps) Packet Size (Bytes) 500 1000 1500 2000 500 1000 1500 2000 Huawei 11-14/1191r0 4,79 5,55 5,84 6 21,98 34,91 43,24 48,67 LGE 11-14/1175r1 4,81 5,55 5,84 5,99 22,4 21,45 35,2 34,26 43,25 42,57 48,9 48,02 Qualcomm 11-14/1192r6 4,76 5,53 5,82 5,98 MediaTek 11-14/1230 4,76 5,53 5,82 5,98 21,71 21,53 34,65 34,46 42,71 42,58 48,15 48,14 Intel 11-14/1192r6 4,76 5,53 5,82 5,98 21,53 34,47 42,57 48,09 Ericsson 11-14/1192r6 4,75 5,52 5,82 5,97 Nokia 11-14/1217r1 4,76 5,52 5,83 5,97 21,19 22 34,22 35 41,93 43,2 47,74 48,4 NTT 11-14/1147r0 4,79 5,54 5,84 6 21,54 34,48 42,6 48,15 Samsung 11-14/1192r6 4,76 5,53 5,82 5,97 21,4 34,2 42,5 48 Broadcom 11-14/1192r6 4,76 5,53 5,83 5,98 21,42 34,23 42,55 48,01 ZTE 11-14/1192r6 4,76 5,53 5,82 5,98 21,94 34,87 43,19 48,62 Toshiba 11-14/1192r6 4,79 5,54 5,83 5,99 23,8 36,64 43,87 49,73 Newracom 11-14/1449r1 4,85 5,55 5,84 5,99 21,99 34,94 43,27 48,68 ETRI 11-14/1342r1 4,79 5,55 5,84 5,99 22,06 35,17 43,26 48,83 WILUS Institute 11-15/0080r0 4,8 5,55 5,84 6 21,94 34,87 43,19 48,66 InterDigital Communications 11-15/0022r1 4,79 5,55 5,84 6 21,96 34,7 43,4 48,5 Apple 11-15/370r0 4,8 5,55 5,84 5,99 21,91 34,78 42,74 48,13 Sony 11-14/1402r0 4,76 5,52 5,81 5,96 Mean Value 4,7805 5,537895 5,830526 5,984737 21,88158 34,78842 42,94105 48,42632 Mean Deviation 0,51% 4,79 0,21% 5,55 0,17% 5,84 0,19% 5,99 2,47% 22 1,54% 34,93 1,03% 43,26 0,92% 48,68 Canon Canon Deviation 0,20% 0,22% 0,16% 0,09% 0,54% 0,41% 0,74% 0,52% Submission Slide 16 St phane Baron et al., Canon
doc.: IEEE 802.11-15/1046r0 September 2015 Test 1a: Application Throughput Comparison (Mbps) Submission Slide 17 St phane Baron et al., Canon
doc.: IEEE 802.11-15/1046r0 September 2015 Test 1a: Application Throughput Comparison (Mbps) Submission Slide 18 St phane Baron et al., Canon
doc.: IEEE 802.11-15/1046r0 September 2015 Test 1b: MAC overhead w RTS/CTS STA 1 AP1 D = 1m Parameter settings MSDU length: [0:500:2000Bytes] 2 MPDU limit RTS/CTS on Data MCS = [0,8] RTS/CTS MCS = 0 ACK MCS = 0 AIFS=DIFS=34us Submission Slide 19 St phane Baron et al., Canon
doc.: IEEE 802.11-15/1046r0 September 2015 Test 1b: Time trace of transmitting/receiving event MSDU Length (B) 500 1000 1500 2000 500 1000 1500 2000 MCS 0 0 0 0 8 8 8 8 CP1: start of RTS (s) 0.000534021 0.000534021 0,000534021 0,000534021 0,000493021 0,000493021 0,000493021 0,000493021 CP2: end of RTS (s) 0.000586024 0.000586024 0.000586024 0.000586024 0,000545024 0,000545024 0,000545024 0,000545024 CP2-CP1 (us) 52,003 52,003 52,003 52,003 52,003 52,003 52,003 52,003 CP3: start of CTS (s) 0.000602024 0.000602024 0.000602024 0,000561024 0,000561024 0,000561024 0,000561024 0.000602024 CP4: end of CTS (s) 0.000646027 0.000646027 0.000646027 0,000605027 0,000605027 0,000605027 0,000605027 0.000646027 CP4-CP3 (us) 44,003 44,003 44,003 44,003 44,003 44,003 44,003 44,003 CP5: start of A-MPDU (s) 0.000662027 0.000662027 0.000662027 0,000621027 0,000621027 0,000621027 0,000621027 0.000662027 CP6: end of A-MPDU (s) 0.003254031 0.004486031 0.005718031 0,000773031 0,000877031 0,000977031 0,001081031 0.002026031 CP6-CP5 (us) 2592,004 3824,004 5056,004 152,004 256,004 356,004 460,004 1364,004 Submission Slide 20 St phane Baron et al., Canon
doc.: IEEE 802.11-15/1046r0 September 2015 Test 1b: Check Points Test Items Standard definition Check points (MCS 0) Matching? MSDU Length (B) 500 1000 1500 2000 ceil((RTSFrameLength*8)/rate/OFD Msymbolduration) * OFDMsymbolduration + PHY Header ceil((CTSFrameLength*8)/rate/OFD Msymbolduration) * OFDMsymbolduration + PHY Header ceil((FrameLength*8)/rate/OFDMsy mbolduration) * OFDMsymbolduration + PHY Header RTS duration (us) Tcp2 - Tcp1 = 52us Tcp2 - Tcp1 = 52us Tcp2 - Tcp1 = 52us Tcp2 - Tcp1 = 52us ok CTS duration (us) Tcp4 Tcp3 = 44us Tcp4 Tcp3 = 44us Tcp4 Tcp3 = 44us Tcp4 Tcp3 = 44us ok Frame Duration (us) Tcp6 Tcp5 = 1364us Tcp6 Tcp5 = 2592us Tcp6 Tcp5 = 3824us Tcp6 Tcp5 = 5056us ok Submission Slide 21 St phane Baron et al., Canon
doc.: IEEE 802.11-15/1046r0 September 2015 Test 1b: Throughput Results Application data size, [Bytes] MSDU size, [Bytes] Numerical MAC Throughput, [Mbit/s] Simulated MAC Throughput, [Mbit/s] MCS index Numerical L4 Throughput, [Mbit/s] Simulated L4 Throughput, [Mbit/s] 4.42563 4.76900 0 464 500 4,42550 4,76886 5.30855 5.50680 0 964 1000 5,30850 5,50674 5.66139 5.80060 0 1464 1500 5,66140 5,80062 5.85231 5.95959 0 1964 2000 5,85227 5,95955 15.94844 17.18582 8 464 500 15,94726 17,18454 27.08341 28.09482 8 964 1000 27,08165 28,09299 34.98730 35.84765 8 1464 1500 34,98741 35,84776 41.37039 41.37039 8 1964 2000 40,62548 41,37014 Submission Slide 22 St phane Baron et al., Canon
doc.: IEEE 802.11-15/1046r0 September 2015 Test 1b: Application Throughput Comparison (Mbps) Company Contribution # MCS0 (6.5Mbps) MCS8 (78Mbps) Packet Size (Bytes) 500 1000 1500 2000 500 1000 1500 2000 Huawei 11-14/1191r0 4,42 5,31 5,66 5,85 15,94 27,07 34,97 40,61 LGE 11-14/1175r1 4,45 5,31 5,66 5,86 16,2 27,3 35 40,8 Qualcomm 11-14/1192r6 4,4 5,29 5,64 5,84 15,67 26,7 34,56 40,18 MediaTek 11-14/1230 4,4 5,29 5,64 5,84 15,79 26,9 34,62 40,24 Intel 11-14/1192r6 4,4 5,29 5,64 5,84 15,7 26,8 34,55 40,26 Ericsson 11-14/1192r6 4,36 5,26 5,62 5,82 15,36 26,33 34,02 40,45 Nokia 11-14/1217r1 4,4 5,28 5,64 5,83 15,52 26,66 34,12 39,96 NTT 11-14/1147r0 4,42 5,3 5,67 5,85 16 27,1 34,97 40,4 Samsung 11-14/1192r6 4,4 5,28 5,63 5,83 15,94 27,09 34,59 40,35 Broadcom 11-14/1192r6 4,4 5,29 5,65 5,84 15,6 26,7 34,5 40,14 ZTE 11-14/1192r6 4,39 5,28 5,64 5,83 15,61 26,61 34,45 40,08 Toshiba 11-14/1192r6 4,42 5,3 5,65 5,85 15,92 27,04 34,94 40,58 Newracom 11-14/1449r1 4,43 5,27 5,62 5,82 16,29 27,06 34,5 39,99 ETRI 11-14/1342r1 4,42 5,31 5,66 5,85 15,94 26,97 34,99 40,63 WILUS Institute 11-15/0080r0 4,43 5,31 5,66 5,85 15,98 27,23 34,99 40,73 InterDigital Communications 11-15/0022r1 4,43 5,31 5,66 5,85 15,95 27,09 35 40,57 Apple 11-15/370r0 4,45 5,31 5,66 5,84 15,94 27,1 34,9 41,43 Sony 11-14/1402r0 4,39 5,28 5,63 5,82 15,88 27,14 34,82 40,21 Mean Value 4,412421 5,293579 5,646895 5,840105 15,85158 26,94579 34,70947 40,43316 Mean Deviation 0,49% 4,43 0,29% 5,31 0,26% 5,66 0,20% 5,85 1,40% 15,95 0,90% 27,08 0,86% 34,99 0,84% 40,62 Canon Canon Deviation 0,31% 0,27% 0,25% 0,20% 0,62% 0,50% 0,81% 0,46% Submission Slide 23 St phane Baron et al., Canon
doc.: IEEE 802.11-15/1046r0 September 2015 Test 1b: Application Throughput Comparison (Mbps) Submission Slide 24 St phane Baron et al., Canon
doc.: IEEE 802.11-15/1046r0 September 2015 Test 1b: Application Throughput Comparison (Mbps) Submission Slide 25 St phane Baron et al., Canon
doc.: IEEE 802.11-15/1046r0 September 2015 Test 2a: Deferral Test 1 Parameter settings MSDU length: [0:500:2000Bytes] 2 MPDU limit RTS/CTS [off, on] Data MCS = [0] RTS/CTS MCS = 0 ACK MCS = 0 AIFS=DIFS=34us CWmax = 1023 D = 1m Submission Slide 26 St phane Baron et al., Canon
doc.: IEEE 802.11-15/1046r0 September 2015 Test 2a: Throughput Results Application Length (B) MSDU Length (B) Simulated Application Layer Throughput (Mbps) Simulated MAC Layer Throughput (Mbps) RTS/CTS PER(%) Off 464 500 10,7 4,597 4,954 Off 964 1000 10,9 5,284 5,481 Off 1464 1500 10,9 5,542 5,679 Off 1964 2000 10,8 5,678 5,783 On 464 500 0 4,466 4,812 On 964 1000 0 5,336 5,536 On 1464 1500 0 5,682 5,822 On 1964 2000 0 5,868 5,976 Submission Slide 27 St phane Baron et al., Canon
doc.: IEEE 802.11-15/1046r0 September 2015 Test 2a: Application Throughput Comparison (Mbps) Company Contribution # Without RTS/CTS With RTS/CTS Packet Size (Bytes) 500 1000 1500 2000 500 1000 1500 2000 Huawei 11-14/1191r0 4,56 5,25 5,51 5,66 4,46 5,33 5,68 5,87 LGE 11-14/1175r1 4,62 5,28 5,54 5,66 4,5 5,34 5,68 5,88 Qualcomm 11-14/1192r6 4,57 5,26 5,53 5,67 4,45 5,32 5,67 5,86 MediaTek 11-14/1230 4,71 5,48 5,78 5,94 4,35 5,24 5,62 5,81 Intel 11-14/1192r6 4,52 5,22 5,48 5,62 4,44 5,31 5,67 5,86 Ericsson 11-14/1192r6 4,53 5,21 5,48 5,63 4,42 5,3 5,65 5,85 Nokia 11-14/1217r1 4,58 5,29 5,56 5,71 4,48 5,32 5,67 5,85 NTT 11-14/1147r0 4,58 5,25 5,45 5,66 4,49 5,35 5,7 5,88 Samsung 11-14/1192r6 4,58 5,27 5,53 5,67 4,45 5,31 5,67 5,86 Broadcom 11-14/1192r6 4,52 5,23 5,47 5,61 4,44 5,32 5,67 5,86 ZTE 11-14/1192r6 4,56 5,25 5,51 5,65 4,39 5,29 5,63 5,82 Toshiba 11-14/1192r6 4,52 5,21 5,48 5,62 4,42 5,3 5,66 5,85 Newracom 11-14/1449r1 4,8 5,49 5,77 5,93 4,39 5,22 5,57 5,77 ETRI 11-14/1342r1 4,59 5,28 5,55 5,68 4,47 5,31 5,65 5,87 WILUS Institute 11-15/0080r0 4,61 5,29 5,55 5,65 4,52 5,37 5,71 5,89 InterDigital Communications 11-15/0022r1 4,64 5,29 5,55 5,7 4,47 5,36 5,71 5,87 Apple 11-15/370r0 4,64 5,28 5,48 5,66 4,51 5,34 5,68 5,86 Sony 11-14/1402r0 4,57 5,33 5,52 5,61 4,43 5,29 5,64 5,82 Mean Value 4,594579 5,286316 5,541053 5,684579 4,449789 5,313474 5,663789 5,852579 Mean Deviation 1,46% 4,60 1,41% 5,28 1,55% 5,54 1,58% 5,68 0,96% 4,47 0,68% 5,34 0,57% 5,68 0,48% 5,87 Canon Canon Deviation 0,11% 0,12% 0,02% 0,08% 0,45% 0,50% 0,29% 0,30% Submission Slide 28 St phane Baron et al., Canon
doc.: IEEE 802.11-15/1046r0 September 2015 Test 2a: Application Throughput Comparison (Mbps) Submission Slide 29 St phane Baron et al., Canon
doc.: IEEE 802.11-15/1046r0 September 2015 Test 2a: Application Throughput Comparison (Mbps) Submission Slide 30 St phane Baron et al., Canon
doc.: IEEE 802.11-15/1046r0 September 2015 Test 2b: Deferral Test 2 STA 2 AP 2 AP1 STA 1 D = 65m D = 65m Parameter settings MSDU length:[1500Bytes] RTS/CTS [ OFF] Data MCS = [0,8] ACK MCS=0 AIFS=DIFS=34us CWmax=1023 2MPDU limit Submission Slide 31 St phane Baron et al., Canon
doc.: IEEE 802.11-15/1046r0 September 2015 Test 2b: Throughput MSDU Length (B) Simulated Application Layer Throughput (Mbps) Simulated MAC Layer Throughput (Mbps) RTS/CTS MCS FA PER(%) Off 0 No 1500 0,66 2,299 2,355 Off 8 No 1500 0,12 28,112 28,804 Off 0 Yes 1500 0,87 0,904 0,926 Off 8 Yes 1500 0,19 37,484 38,406 Submission Slide 32 St phane Baron et al., Canon
doc.: IEEE 802.11-15/1046r0 September 2015 Test 2b: Application Throughput Comparison (Mbps) Company Contribution # MCS0 MCS8 noFA FA noFA FA Huawei 11-14/1191r0 1,62 1,01 26,54 34,75 LGE 11-14/1175r1 1,7 1,02 0,98 26,8 35 Qualcomm 11-14/1192r6 MediaTek 11-14/1230 0,03631 1,01 1,61 26,66 35,2 Intel 11-14/1192r6 1,78 1,22 25,49 33,52 Ericsson 11-14/1192r6 Nokia 11-14/1217r1 1,2 1,06 35,66 35,27 1,71 26,77 NTT 11-14/1147r0 1,01 37,22 Samsung 11-14/1192r6 1,05 34,3 Broadcom 11-14/1192r6 1,2 ZTE 11-14/1192r6 1,01 35,11 Toshiba 11-14/1192r6 1,03 34,21 Newracom 11-14/1449r1 1,62 0,95 28,85 33,96 ETRI 11-14/1342r1 1,02 34,3 WILUS Institute 11-15/0080r0 1,38 23,61 InterDigital Communications 11-15/0022r1 1,59 1,08 26,3 33,67 Apple 11-15/370r0 1,05 37,44 Sony 11-14/1402r0 Mean 1,74 12,44% 2,29 1,011595 25,13% 0,904 26,94025 3,67% 28,112 34,419 8,86% 37,484 Deviation Canon Canon Deviation 31,61% 10,64% 4,35% 8,90% Submission Slide 33 St phane Baron et al., Canon
doc.: IEEE 802.11-15/1046r0 September 2015 Test 2b: Application Throughput Comparison (Mbps) Submission Slide 34 St phane Baron et al., Canon
doc.: IEEE 802.11-15/1046r0 September 2015 Test 3: NAV Deferral STA 2 AP 2 AP1 STA 1 D = 65m D = 65m Parameter settings MSDU length:[1500Bytes] RTS/CTS [ ON] Data MCS = [0,8] RTS/CTS MCS = 0 ACK MCS=0 AIFS=DIFS=34us CWmax=1023 2MPDU limit Submission Slide 35 St phane Baron et al., Canon
doc.: IEEE 802.11-15/1046r0 September 2015 Test 3: Throughput MSDU Length (B) Simulated Application Layer Throughput (Mbps) Simulated MAC Layer Throughput (Mbps) RTS/CTS MCS FA PER(%) On 0 No 1500 0 5,141 5,267 On 8 No 1500 0 22,116 22,660 On 0 Yes 1500 0 5,602 5,740 On 8 Yes 1500 0 34,108 34,946 Submission Slide 36 St phane Baron et al., Canon
doc.: IEEE 802.11-15/1046r0 September 2015 Test 3: Application Throughput Comparison (Mbps) Company Contribution # MCS0 MCS8 noFA 5,15 FA 5,58 noFA 22,04 FA 34,05 Huawei 11-14/1191r0 5,14 5,58 22,4 34,2 LGE 11-14/1175r1 5,55 Qualcomm 11-14/1192r6 5,63933 MediaTek 11-14/1230 5,06 5,57 20,35 31,93 Intel 11-14/1192r6 5,21 5,63 22,84 34,41 Ericsson 11-14/1192r6 5,59 31,35 Nokia 11-14/1217r1 5,18 5,6 22,1 34,01 NTT 11-14/1147r0 5,41 33,55 Samsung 11-14/1192r6 5,32 30,45 Broadcom 11-14/1192r6 5,58 ZTE 11-14/1192r6 5,61 33,81 Toshiba 11-14/1192r6 5,78 34,24 Newracom 11-14/1449r1 5,19 5,61 21,64 33,82 ETRI 11-14/1342r1 5,74 38,16 WILUS Institute 11-15/0080r0 5,8 22,92 InterDigital Communications 11-15/0022r1 5,1 5,59 21,05 33,86 Apple 11-15/370r0 5,49 33,56 Sony 11-14/1402r0 Mean Value 5,146375 0,89% 5,141 5,593228 1,95% 5,602 21,817 3,39% 22,116 33,02675 9,26% 34,108 Mean Deviation Canon Value Canon Deviation 0,10% 0,16% 1,37% 3,27% Submission Slide 37 St phane Baron et al., Canon
doc.: IEEE 802.11-15/1046r0 September 2015 Test 3: Application Throughput Comparison (Mbps) Submission Slide 38 St phane Baron et al., Canon
doc.: IEEE 802.11-15/1046r0 September 2015 Test 4: Deferral Test for 20 and 40MHz BSSs Parameter settings MSDU length: 2000Bytes RTS/CTS [off, on] MCS = [0] channel bandwidth: BSS1: 40MHz BSS2: 20MHz (the secondary channel of BSS1) traffic model: BSS1: full buffer BSS2: Poisson distribution with lamda=100 D = 1m Submission Slide 39 St phane Baron et al., Canon
doc.: IEEE 802.11-15/1046r0 September 2015 Test 4: Throughput Results Application Length (B) MSDU Length (B) Simulated Application Layer Throughput (Mbps) Simulated MAC Layer Throughput (Mbps) BW mode TX Time (%) 20MHz/40MHz RTS/CTS PER(%) Off Adapt. 1964 2000 2,847 8,719722 8,879554 50,34088 49,65912 Off Fixed 1964 2000 7,769 1,555112 1,583617 100 0 On Adapt. 1964 2000 0,000 8,486177 8,641728 52,88736 47,11263 On Fixed 1964 2000 0,000 1,555450 1,583961 100 0 Submission Slide 40 St phane Baron et al., Canon