IEEE 802.11ax OFDMA Simulation Results Comparison
Explore the simulation results comparing the system throughput of 11ac and 11ax OFDMA in a single BSS scenario. Learn about the performance gains of 11ax OFDMA as the number of STAs increases, with a focus on UL throughput. Discover the setup, topologies, PHY abstraction, SINR calculation, and access category settings in these simulations to verify the performance of IEEE 802.11-16/1604r0.
Download Presentation

Please find below an Image/Link to download the presentation.
The content on the website is provided AS IS for your information and personal use only. It may not be sold, licensed, or shared on other websites without obtaining consent from the author. If you encounter any issues during the download, it is possible that the publisher has removed the file from their server.
You are allowed to download the files provided on this website for personal or commercial use, subject to the condition that they are used lawfully. All files are the property of their respective owners.
The content on the website is provided AS IS for your information and personal use only. It may not be sold, licensed, or shared on other websites without obtaining consent from the author.
E N D
Presentation Transcript
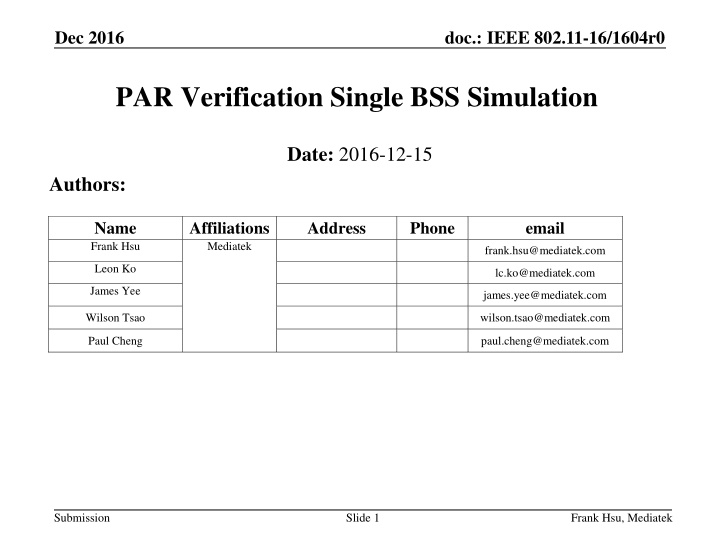
Dec 2016 doc.: IEEE 802.11-16/1604r0 PAR Verification Single BSS Simulation Date: 2016-12-15 Authors: Name Frank Hsu Affiliations Mediatek Address Phone email frank.hsu@mediatek.com Leon Ko lc.ko@mediatek.com James Yee james.yee@mediatek.com Wilson Tsao wilson.tsao@mediatek.com Paul Cheng paul.cheng@mediatek.com Submission Slide 1 Frank Hsu, Mediatek
Dec 2016 doc.: IEEE 802.11-16/1604r0 Summary In this presentation, we show several UL system throughput simulation results comparing 11ac and 11ax OFDMA As the number of STAs increases, in UL, 11ax OFDMA has more system throughput gain over 11ac The single BSS scenario is the first step to verify 11ax s performance. We will continue to work on multiple BSS scenario definition and simulation, and make contribution to TGax Simulation scenario and EVM documents Submission Slide 2 Frank Hsu, Mediatek Inc.
Dec 2016 doc.: IEEE 802.11-16/1604r0 Single BSS Simulation Setup (1/3) Topologies 1. 2. 3. AP is at the center in the space STAs are randomly dropped in the area STA density is the same of the 3 topologies 10m x 10m area with 20 STAs 20m x 20m area with 80 STAs 30m x 30m area with 180 STAs Submission Slide 3 Frank Hsu, Mediatek Inc.
Dec 2016 doc.: IEEE 802.11-16/1604r0 Single BSS Simulation Setup (2/3) PHY abstraction and SINR calculation Follow 11ax evaluation methodology [1] MAC protocols, such as CCA, back-off, trigger frame, and etc. Based on 11ax draft D1.0 [2] General settings Parameters Default Value Traffic type Full buffer UDP UL traffic UDP packet size 100 Bytes AP/STA # of TX/TX antenna 1 Access Protocol parameters EDCA with default parameters Bandwidth 80 MHz Aggregation 64 MPDU per AMPDU RTS/CTS No Submission Slide 4 Frank Hsu, Mediatek Inc.
Dec 2016 doc.: IEEE 802.11-16/1604r0 Single BSS Simulation Setup (3/3) Access category setting 1/3 STAs are AC_VI (15, 31) 1/3 STAs are AC_VO (7, 15) 1/3 STAs are AC_BE (31, 1023) MCS setting 11ac: Genie helped, best MCS to reach just under 10% PER (distance dependent) 11ax OFDMA: MCS9 OFDMA (80MHz) 8 106-tone RU users 5 26-tone RU users OFDMA scheduling For each RU, AP selects a STA randomly Submission Slide 5 Frank Hsu, Mediatek Inc.
Dec 2016 doc.: IEEE 802.11-16/1604r0 Topology 1: 20 STAs UL System throughput 11ac 70.14 Mbps 11ax OFDMA 198.74 Mbps 11ax OFDMA has 2.83 times gain over 11ac Throughput Histogram 11ac Three groups throughputs VO (Mean: 6.8 Mbps) VI (Mean: 2.45 Mbps) BE (Mean: 0.17 Mbps) 11ax All STAs have similar throughputs because of no priority scheduling Mean throughput 9.93 Mbps 10 9 8 7 6 10m 5 4 3 2 1 0 0 1 2 3 4 5 6 7 8 9 10 10m Throughput Histogram 20 STAs 11ac 20STA 20 15 BE STA count VI 10 VO 11ac 5 0 0 2 4 6 8 10 12 Throughput(Mbps) 11ax OFDMA 20STA 20 15 STA count 11ax 10 5 0 0 2 4 6 8 10 12 Throughput(Mbps) Submission Slide 6 Frank Hsu, Mediatek Inc.
Dec 2016 doc.: IEEE 802.11-16/1604r0 Throughput CDF of 20 STAs 5% percentile throughput 11ac 0.017 Mbps 11ax OFDMA 9.87 Mbps 20STA Throughput CDF CDF 1 11ac 11ax OFDMA 0.9 0.8 0.7 0.6 0.5 0.4 0.3 0.2 0.1 0 0 2 4 6 8 10 12 Throughput(Mbps) Submission Slide 7 Frank Hsu, Mediatek Inc.
Dec 2016 doc.: IEEE 802.11-16/1604r0 Topology 2: 80 STAs UL System throughput 11ac 39.3 Mbps 11ax OFDMA 180.0 Mbps 11ax OFDMA has 4.58 times gain over 11ac Throughput Histogram 11ac Three groups throughputs VO (Mean: 0.95 Mbps) VI (Mean: 0.41 Mbps) BE (Mean: 0.04 Mbps) 11ax Most STAs have similar throughputs because of no priority scheduling Some STAs have a little worse throughputs due to their longer distance to AP Mean throughput 2.25 Mbps 20 18 16 14 12 20m 10 8 6 4 2 0 0 2 4 6 8 10 12 14 16 18 20 20m Throughput Histogram 80 STAs 11ac 80STA 40 30 11ac STA count 20 10 0 0 0.5 1 1.5 2 2.5 Throughput(Mbps) 11ax OFDMA 80STA 40 30 STA count 20 11ax 10 0 0 0.5 1 1.5 2 2.5 Throughput(Mbps) Submission Slide 8 Frank Hsu, Mediatek Inc.
Dec 2016 doc.: IEEE 802.11-16/1604r0 Throughput CDF of 80 STAs 5% percentile throughput 11ac 0.02 Mbps 11ax OFDMA 2.09 Mbps 80STA Throughput CDF CDF 1 11ac 11ax OFDMA 0.9 0.8 0.7 0.6 0.5 0.4 0.3 0.2 0.1 0 0 0.5 1 1.5 2 2.5 3 3.5 4 Throughput(Mbps) Submission Slide 9 Frank Hsu, Mediatek Inc.
Dec 2016 doc.: IEEE 802.11-16/1604r0 Topology 3: 180 STAs UL System throughput 11ac 12.51 Mbps 11ax OFDMA 138.95 Mbps 11ax OFDMA has 11.1 times gain over 11ac Throughput Histogram 11ac Three groups throughputs VO (Mean: 0.14 Mbps) VI (Mean: 0.058 Mbps) BE (Mean: 0.001 Mbps) BE STAs has almost zero throughput 11ax Most STAs have similar throughputs because of no priority scheduling Some STAs have a little worse throughputs due to their longer distance to AP Mean throughput 0.77 Mbps 30 25 20 30m 15 10 5 0 0 5 10 15 20 25 30 30m Throughput Histogram 180 STAs 11ac 180STA 100 80 11ac 60 STA count 40 20 0 0 0.1 0.2 0.3 0.4 0.5 0.6 0.7 0.8 0.9 1 Throughput(Mbps) 11ax OFDMA 180STA 100 80 60 STA count 40 11ax 20 0 0 0.1 0.2 0.3 0.4 0.5 0.6 0.7 0.8 0.9 1 Throughput(Mbps) Submission Slide 10 Frank Hsu, Mediatek Inc.
Dec 2016 doc.: IEEE 802.11-16/1604r0 Throughput CDF of 180 STAs 5% percentile throughput 11ac 0 Mbps 11ax OFDMA 0.67 Mbps 180STA Throughput CDF CDF 1 11ac 11ax OFDMA 0.9 0.8 0.7 0.6 0.5 0.4 0.3 0.2 0.1 0 0 0.2 0.4 0.6 0.8 1 1.2 1.4 1.6 1.8 2 Throughput(Mbps) Submission Slide 11 Frank Hsu, Mediatek Inc.
Dec 2016 doc.: IEEE 802.11-16/1604r0 Discussion For 11ac Contention and collision determine the system throughput As the number of STA increases, high priority AC STAs grab all UL opportunities with serious collisions Overall throughput drops a lot (70.14 -> 39.3 -> 12.51) AC BE STAs almost cannot transmit. 5% percentile throughput is closed to zero For 11ax OFDMA No collision As the number of STA increases, OFDMA can maintain a stable UL system throughput The system throughput drops because there are more distant STAs and their PERs are higher AP may determine STA s UL throughput by scheduling 5% percentile throughput is determined by AP s scheduling Submission Slide 12 Frank Hsu, Mediatek Inc.
Dec 2016 doc.: IEEE 802.11-16/1604r0 Next Step 11ax shall not only improve system throughputs of single BSS scenarios We will continue working on multiple BSS scenario definition and simulation, and make contribution to TGax Simulation scenario and EVM documents Submission Slide 13 Frank Hsu, Mediatek Inc.
Dec 2016 doc.: IEEE 802.11-16/1604r0 References 1. 2. 11-14-0571-12-00ax-evaluation-methodology.docx Draft P802.11ax_D1.0.pdf Submission Slide 14 Frank Hsu, Mediatek Inc.


