IEEE P802.15.13 MAC Layer Support for Optical Frontends Proposal
This document presents a proposal for protocol procedures and frame types to facilitate distributed optical frontends and MIMO techniques in a star topology. It introduces concepts like spatial diversity, spatial reuse, and smooth handover performance to enhance quality of service. The approach involves low-level soft handover and forming virtual cells transparent to the management protocol, enabling efficient coordination and utilization of optical frontends.

Uploaded on Mar 16, 2025 | 2 Views
Download Presentation

Please find below an Image/Link to download the presentation.
The content on the website is provided AS IS for your information and personal use only. It may not be sold, licensed, or shared on other websites without obtaining consent from the author.If you encounter any issues during the download, it is possible that the publisher has removed the file from their server.
You are allowed to download the files provided on this website for personal or commercial use, subject to the condition that they are used lawfully. All files are the property of their respective owners.
The content on the website is provided AS IS for your information and personal use only. It may not be sold, licensed, or shared on other websites without obtaining consent from the author.
E N D
Presentation Transcript
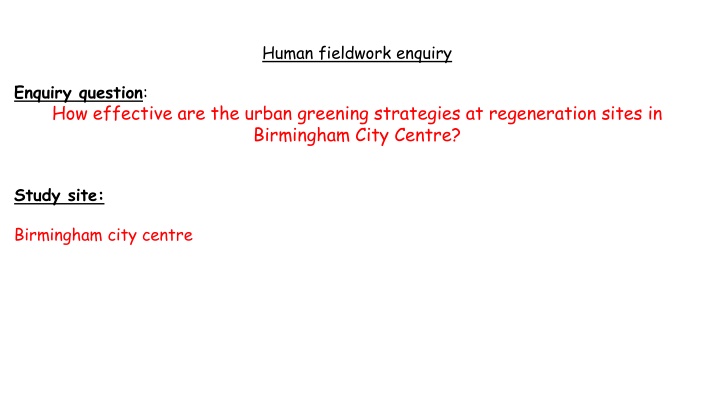
Human fieldwork enquiry Enquiry question: How effective are the urban greening strategies at regeneration sites in Birmingham City Centre? Study site: Birmingham city centre
Toilet break Sites of Urban Greening Sites of Urban Greening Site 5: Cathedral grounds (optional) Site 1: Eastside City Park Lunch /toilets Site 4: Birmingham Library Site 2: Grand Central Site 3: Victoria Square
Factor Why was Birmingham chosen? Location 45-60 minutes away easy to access if we need to revisit and allows more time to collect data Large areas of Birmingham have been regenerated urban greening is visible in these areas. Allowing us to compare the sites effectiveness Pedestrianised streets safer to visit and collect data
Risk assessment Strategies to Minimise Risk Ensure proper clothing is worn/taken e.g. waterproofs, sun cream, hat, water Ensure pupils take care when crossing roads, and that they only cross roads at pedestrian crossings. Hazard Risk Cold wet weather or hot sunny weather. Weather Injuries, accidents. Traffic/carparks Disturbing the public or stranger danger. Ensure pupils do not take over the whole pathway, and are respectful. Stay in pairs at all times. The public
It is important to carry out risk assessment to ensure a safe fieldwork environment is created for all students. It also allows teachers to plan for any risks that may occur and have strategies in place to minimise the risks as much as possible.
Sampling Strategies Strategy Data Sampled Explanation Stratified sampling is when the population is made up of sub-groups. Systematic sampling is when you work to a system to collect data. Random sampling is where every person or place has an equal chance of being selected. Disadvantages Number of samples in a group must be known. Accurate information of ample must be known. More bias, as not all points have an equal chance of being selected. Time and access constraints. Can lead to poor representation of whole population. Stratified Questionnaire Systematic Environmental Quality Survey Random N/A Strategy Advantages Can generate accurate results. Comparing sets of data made easy. Stratified Systematic Good coverage of study area. Used in a large population. Avoids bias Random
Data Collection Methods Primary Secondary Qualitativ Use photographs and other peoples sketches to support. Sketches e Environmental Quality Survey Biodiversity survey Noise level Air temperature and humidity Quantitat Using other peoples results. ive
Strategy Method Justification of the method Limitations For each site, a field sketch was drawn of the urban greening strategy and a brief description of the area written. Field sketch I can visually see how effective urban greening has been i.e. size, use of the areas. Must be labelled. Only a snap shot in time (does not show changes overtime) Environmental quality survey For each site, statements were rated according to how strongly I agreed or disagreed with them. Enables us to compare data across the 5 sites to see how effective the features of urban greening have been. It is a subjective method some will find a location unattractive, while others may find the same place very attractive (likely to give different scores) - ,
Urban greening is meant to encourage wildlife into the area I can compare the effectiveness across the sites. It will show where the number of species is higher or lower. Urban greening areas are meant to be quiet and tranquil areas for people to relax and unwind. I can compare the effectiveness. Urban greening areas regulate temperature. I can compare the sites in terms of size of greening and effect on temperature. For each site, a two minute timer was set then a count was conducted of species in the green space. Biodiversity survey Only a small area surveyed (within eye view) not all the site. Time of the day will affect results collected. For each site, using a decibel reader the noise levels were measured 3 times. An average was taken. Noise level Doesn t explain what the noise is. Depends on the day/time/weather. Snap shot in time. Recorded at different times of the day across each site -Cheap equipment completely accurate? Air temperature and humidity For each site, temperature and humidity was recorded three times.
Data Presentation Scattergraph Radial graphs Immediate visual representation of averages of the data. Clearly see a correlation between the data. Easy to plot and understand. Clear to read and anyone can understand them. There s no locational information shown so it isn t possible to see where each respondent was standing when they recorded the information. When placed side by side it s very easy to compare the environments at each site. Advantages If scores are zero, the graph looks incomplete and so can be confusing. Disadvantages
Statement SITE 1 2 3 4 5 6 The vegetation appears healthy. The vegetation is attractive. There is a variety of plants, grass, trees. Bird sound can be heard. There is evidence of insects (e.g. bees, butterflies). There is evidence of bird boxes / feeders etc to attract wildlife. There is evidence of bat boxes Scent from the vegetation is evident. People in the area appear relaxed. People are using the area to socialise. There are seats for people to use to relax in the area. Shade from the sun / rain is created by the vegetation. There is no litter evident. There is no graffiti evident. TOTAL (The higher the score, the better the environment) 4 4 4 3 4 2 5 4 4 3 2 1 5 5 4 4 5 1 5 5 5 4 5 5 3 3 4 2 2 1 1 2 4 3 5 5 4 4 49 1 1 2 2 4 1 3 5 38 1 2 5 5 4 2 2 2 57 1 5 5 4 5 2 5 4 60 1 1 4 5 4 5 4 3 42
Data analysis. How effective are the urban greening strategies at regeneration sites in Birmingham City Centre? Radial graphs - Environmental quality survey The graph shows the Environmental Quality Scores for each location which were totalled after being rated according to each statement. The site which scored highest on the EQS was number 4, the library garden, with 60 out of a potential 70. In contrast, the lowest was site 2 at Grand Central with 38. The difference of 22 points between the sites was expected due to site 2 s proximity to the railway line and commuters rushing around. This site also lacked shaded seating. The sites increased in quality with distance from the city centre, supporting this trend. Overall, sites 3 and 4 were the most effective at increasing the amount of green space in the city, having scored 57 and 60/70. Site 2 only scored 38/70 therefore some sites are not as effective in providing urban greening to their populations.
Scatter graph showing a correlation between biodiversity and noise levels. Site Average noise level Biodiversity count 1 2 3 4 5 6 100.2 87.4 68.7 63.6 72.4 13 6 14 18 12
Data analysis. How effective are the urban greening strategies at regeneration sites in Birmingham City Centre? Scattergraph - Biodiversity and noise levels Generally, the greater the biodiversity count, the lower the average noise pollution level. Site 4 s biodiversity count (18 species) was the highest, with the lowest average noise (63.6 decibels). This was to be expected because it is on the roof of the library building away from the main road. It is designed to be a peaceful place to sit and read a book or have lunch. Site 1 was an anomaly. It scored the third highest biodiversity count (13), but had the highest average noise ( 100.2 decibels). This could be due it being a large space to survey. Also due to the regeneration work being completed opposite the site, which is a temporary feature. Site 2 had the second highest noise recorded (87.4 decibels) with the lowest biodiversity count (6). This was expected due to the train station being directly below the site and it being a walk through to the city centre/train station. Overall, site 1, 3, 4 and 5 have similar biodiversity counts suggesting the strategies used in these sites to increase urban greening have been successful in encouraging more wildlife. However, site 2 has been less effective because its biodiversity count was by far the lowest, suggesting more work needs to be done in this area in order to attract more species.
Bar graph showing average temperature and humidity at each site. Site Average temp. Average humidity 1 2 3 4 5 28.8 33.2 32.3 31.4 30.2 36 29 32 33 31
Data analysis. How effective are the urban greening strategies at regeneration sites in Birmingham City Centre? Bar graph - Average air temperature and humidity The bar graph shows that site 3 recorded the highest average temperature (32.3 degrees). This could be due to the amount of surface that was concrete/tarmac, therefore absorbing the heat during the day creating the urban heat island effect. The lowest temperature was recorded at site 2. This could be due to the amount of green open space or due to the time it was measured (10am in the morning). Overall, most sites recorded a similar average temperature, except site 2. This suggests urban greening strategies are effective in regulating temperatures across the city.
Birmingham regeneration What is regeneration? Regeneration is a process of change over time and is the result of innovation, new technology and thinking about an area that is no longer fit for purpose. It is also the process of renewing old sites that have become disused or rundown and bringing them back into use. Why is regeneration taking place in Birmingham? Regeneration has taken place as there was a need to replace the jobs lost in manufacturing with a service based economy. In order to do this, regeneration was designed to attract international companies for investment and to become the UK s top regional centre for conferences and exhibitions.
Conclusions:How effective are the urban greening strategies at regeneration sites in Birmingham City Centre? What conclusions can you draw from your results? In conclusion, site 3 (Victoria Square) and 4 (Birmingham Library) have the most effective urban greening strategies after scoring the highest scores on their environmental quality and the highest biodiversity counts. However, site 2 s (New Street train station) urban greening strategies seem less effective. It scored the lowest score on the environmental quality survey and the lowest score in the biodiversity count. But, we must remember site 2 is a green wall located outside of a busy pathway into the train station, rather than a dedicated open area of space or quiet location.
Evaluation How accurate, reliable or bias were your results? Strengths Limitations Some methods are subjective and so dependent on people s opinions and so reduces the reliability of our results. Data was only collected on one day at one point in time for each site, and so if we returned to sites later in the day we may have had differing results which could have impacted our conclusion. Improvements Five clear methods were used to collect a range of qualitative and quantitative data. Care was taken when collecting data to reduce bias by ensuring that everyone had a clear idea of what was required. Methods It would have helped to provide photos alongside the sketches. Since a range of data was collected this has enabled us to use a range of data presentation techniques to assess the accuracy of our data. Our conclusions are as accurate as they can be based on the primary data gathered. They reach an informed judgement about how effective urban greening strategies at regeneration sites in Birmingham city centre are. Biodiversity surveys, noise level, air temperature was only completed on one day at one point in the day. This means that it would not give us an accurate representation. To improve the biodiversity count, air temperature and noise recordings we could return to the sites at different times of the day/seasons. Results Our conclusions may not be reliable as they are based on our data which was collected on one day and so people repeating this study may not be able to collect similar data, depending on the weather and time of year when they carry out their data collection. Return to Birmingham City Centre at different intervals throughout the year so that we can average our results, making our conclusion more reliable. Use secondary data to support our findings. Conclusions