IGAD Resilience Index (IRI)
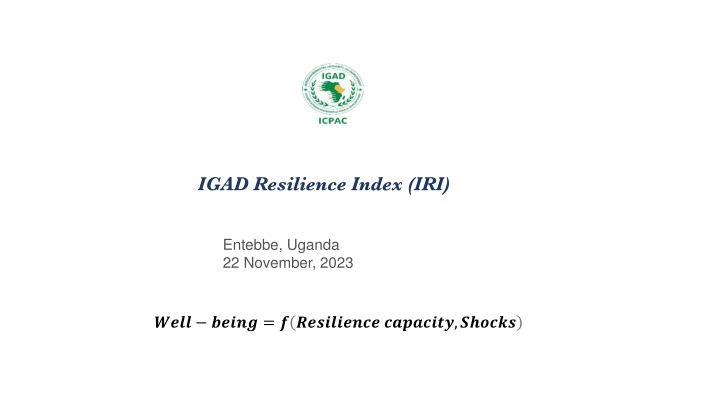
The IGAD Resilience Index (IRI) in Entebbe, Uganda aims to measure and improve resilience. It provides evidence-based data to enhance decision-making at country and regional levels. The assessment process involves high-level indicators, criteria, sub-criteria, and attributes categorized into capacities like Transformative, Anticipatory, Absorptive, and Adaptive. The total resilience index for a country is determined by normalized scores of indicators, indicating the state of resilience from crises to resilient. The Analytic Hierarchy Process (AHP) is used for weighing in this collaborative effort.
Uploaded on Mar 11, 2025 | 2 Views
Download Presentation

Please find below an Image/Link to download the presentation.
The content on the website is provided AS IS for your information and personal use only. It may not be sold, licensed, or shared on other websites without obtaining consent from the author.If you encounter any issues during the download, it is possible that the publisher has removed the file from their server.
You are allowed to download the files provided on this website for personal or commercial use, subject to the condition that they are used lawfully. All files are the property of their respective owners.
The content on the website is provided AS IS for your information and personal use only. It may not be sold, licensed, or shared on other websites without obtaining consent from the author.
E N D
Presentation Transcript
IGAD Resilience Index (IRI) Entebbe, Uganda 22 November, 2023 ???? ????? = ? ?????????? ????????,??????
Introduction What gets measured gets improved . If we cannot measure resilience, it is challenging, if not impossible, to know the effectiveness of our resilience- strengthening interventions or to make data-driven decisions to manage and conceptualize resilience and improve it as necessary. While progress has been made globally, on resilience measurement and analysis, how evidence from such measurement activities may support country and regional level decision making requires a focused response. To be effective, resilience measurement evidence is required to be more directly connected to decision making within countries and across regions.
IGAD Resilience Index (IRI) The IGAD Resilience Index (IRI) is a collaborative and demand driven effort that seeks to meet stakeholders needs for evidence that has both technical rigour and practical value.
Assessment process There are 9 high-level indicators, assessed with 25 criteria and 31 sub-criteria, and 11 attributes. Each of the nine overarching indicators (along with their corresponding criteria) will be categorized within a minimum of one of the capacities: Transformative, Anticipatory, Absorptive, and Adaptive, which are embraced by both the TANGO and RIMA-II frameworks.
Assessment process The total resilience index for a specific country is determined by adding up the normalized scores of the high-level indicators, as outlined in the Equation . ???= ????+ ????+ ???? ..???? This index has a potential range of values from zero to one hundred. To arrive at this index, initially the individual indexes for all nine resilience capacity indicators are computed. These individual indicators are then synthesized to form a comprehensive measure of resilience for that country.
Assessment process RIn < 40 State of resilience Colour code Crises >= 40 and < 60 Concern >= 60 and <75 Moderate >=75 Resilient
Weighing Process The Analytic Hierarchy Process (AHP) was applied to initiate the weighing process. The AHP involves a series of pairwise comparisons wherein each element (indicator, criterion, or sub- criterion) is compared against every other element.
The comparisons are made using a scale ranging from 0 to 1, allowing for a quantitative assessment of their significance. The results obtained through the AHP process were shared and discussed in a workshop involving subject matter experts, representatives from IGAD member states, the IGAD Secretariat, Specialized Institutions, and other stakeholders.
Weighing Process Notably, representatives from member states actively participated in this weighing process, considering the unique circumstances and contexts of their respective countries. Their active involvement ensured that the weights assigned were meaningful and reflective of their countries' realities and specific contexts.
Weighing Process Following the workshop, the feedback and insights provided by the experts, particularly the representatives from member states, were integrated into the weighing system. This integration enhanced the accuracy and relevance of the weights assigned to indicators, criteria, and sub-criteria. The protocol then underwent a pilot phase in Ethiopia, Kenya, and Uganda, where its effectiveness and practicality were assessed in real-world settings.
Indicators, Criteria Sub-Criteria & Attributes Indicator Criteria Sub-criteria Precipitation (22%) Soil moisture (10%) Vegetation conditions (15%) Combined Drought Index (53%) Reservoir water level (17%) River discharge (17%) Groundwater conditions (16%) Vegetation conditions (33%) Soil moisture (17%) Forecasting (50%) Drought Early Warning System (15%) Monitoring and Observation (30%) Communication and outreach (20%) Communication strategy (100%) Calculation procedure Dichotomous Question Type, with Yes/No answer. Yes = 1, No = 0 Sub-criteria score = answer of the question * its weight Xs = Weighed criteria score Iw = Indicator weight
Indicators, Criteria Sub-Criteria & Attributes Proportion of the population supported by the social protection programs (20%) Government spending on basic services, as percentage of total government spending (35%) Planning and preparedness for drought (17%) Proportion of the population experiencing moderate and severe food insecurity (25%) Existence of formal drought preparedness and response manual (20%) ((sum(X1-4)*w1-4))*Wind-2
Indicators, Criteria Sub-Criteria & Attributes Observed Value Indicator value Indicator Criteria Vulnerability Adaptation to Climate Variability (14%) 3 Readiness to climate variability ND-GAIN Score = (((Readiness Score Vulnerability Score + 1) * 50)/100))*0.14
Indicators, Criteria Sub-Criteria & Attributes Proportion of unemployed work force (20%) Dependency ratio (15% Member States' Ministries of Agriculture Food Security Readiness (14%) Affordability (40%) Proportion of people living below the national poverty line (16%) Proportion of farmers/pastoralists with access to financial services (49%) Countries' reports on Malabo Declaration
Indicators, Criteria Sub-Criteria & Attributes Existence of competent regulatory institutions with clear mandates and coordination mechanism (50%) Existence of national food safety policy, act or law updated at least in the last 10 years and covering the entire food chain (30%) Existence of risk based food safety standards for at least 5 priority commodities (20%) Existence of Food Safety Regulations and Policies (30%) Existence of Legal and Institutional Frameworks on Food Safety (50%) Existence of a risk-based and coordinated food safety monitoring/surveillance plan (40) Existence of a national epidemiological database/system for storing information on food borne disease (30%) Food safety (16%) Existence of quality monitoring and surveillance programs (20) Existence of a food safety response system with standard operating procedure, traceability and recall system (30%) Proportion of people with access to improved water supply (60%) Proportion of people with access to improved sanitation (40%) Water Supply and Sanitation (50%)
Ratio of public expenditure in agr. to the total public expenditure (45%) Ratio of annual public agri expenditure in the total agriculture value added (35%) Proportion of Official Development Assistance (ODA) committed to implement the NAIPs disbursed to country (20% Proportion of public expenditure in agriculture (29%) Countries' reports on Malabo Declaration Quantity of fertilizer use Kg per hectare of arable land (20%) Proportion of irrigated area to the total irrigable land (15) Proportion of farmers/pastoralists having access to Agricultural Advisory Services (10%) Proportion of Agricultural Research Spending as a share of AgGDP (7%) Proportion of adult agricultural population with ownership or secure land rights over agricultural land (35%) Countries' reports on Malabo Declaration Countries' reports on Malabo Declaration Food Security Readiness (10.5%) Availability (44%) Countries' reports on Malabo Declaration Countries' reports on Malabo Declaration Countries' reports on Malabo Declaration
Indicators, Criteria Sub-Criteria & Attributes ? ???? ???? ???? ?? = Where CS is the fertilizer use score, X is the reported value of country under the consideration XMax and XMin are the continental requirement (50 kg/h) and 0, respectively. With this equation, the performance of the countries can be measured against the global average.
Indicators, Criteria Sub-Criteria & Attributes Indicator Criteria Food Balance Sheet (67%) Source of Data Food and feed balance sheets (4%) Countries' Ministries of Agriculture + Statistics Bureaus Feed Balance Sheet (33%) Balance sheet available Yes (1) No (0) Indicator Criteria Food reserve (67%) Source of Data Countries' Ministries of Agriculture Food and feed reserve (6%) Feed reserve (33%) Food and feed reserve established Yes (1) No (0)
Indicators, Criteria Sub-Criteria & Attributes Indicator Criteria Sub-criteria Electricity Access (47%) Clean Cooking (8%) Source of Data Sustainable Energy (32%) SDG 7 Renewable Energy (27%) Energy Efficiency (18%) Enabling environment (41) Institutions and participation (45) Management instrument (39) Financing (37) Proportion of agricultural land under SLM Natural Resources Management (14%) Integrated Water Resources Management (46%) SDG Reports Sustainable Land Management (22%) Malabo Biennial Reports
Indicators, Criteria Sub-Criteria & Attributes Indicator Criteria Source of Data Proportion of women that make decisions about agricultural production (18%) Malabo Report Proportion of women that have access to and decision-making power about productive resources (20%) Malabo Report Roles and extent of women's engagement in agriculture sector (10%) Proportion of women that have control over use of income (22%) Proportion of women that is in leadership in the community (40%) Malabo Report Malabo Report
Indicators, Criteria Sub-Criteria & Attributes Indicator Criteria Average adult years of schooling Expected years of schooling Source of data Member States Ministries of Education + UNDP's HDI reports Literacy (6%) MYS = Mean years of schooling; EYS = Expected years of schooling. The mean years of schooling is 15 and is the projected maximum of this indicator for 2025, whereas the expected years of schooling is18, which is equivalent to achieving a master s degree in most countries
Indicators, Criteria Sub-Criteria & Attributes Total resilience Index (RI) = SUM(weighed Inficators)*100; Ranges between 0 and 100
