Illustrations of Delamanid and STREAM 1 Phase III Trial Results
Explore the results of Delamanid and STREAM 1 Phase III trials showcasing superiority and non-inferiority in TB treatment modalities. Dive into the comparison of time to conversion, risk differences, and conclusions from the study. Gain insights into the potential new treatment algorithms for RR/MDR-TB.
Download Presentation

Please find below an Image/Link to download the presentation.
The content on the website is provided AS IS for your information and personal use only. It may not be sold, licensed, or shared on other websites without obtaining consent from the author. If you encounter any issues during the download, it is possible that the publisher has removed the file from their server.
You are allowed to download the files provided on this website for personal or commercial use, subject to the condition that they are used lawfully. All files are the property of their respective owners.
The content on the website is provided AS IS for your information and personal use only. It may not be sold, licensed, or shared on other websites without obtaining consent from the author.
E N D
Presentation Transcript
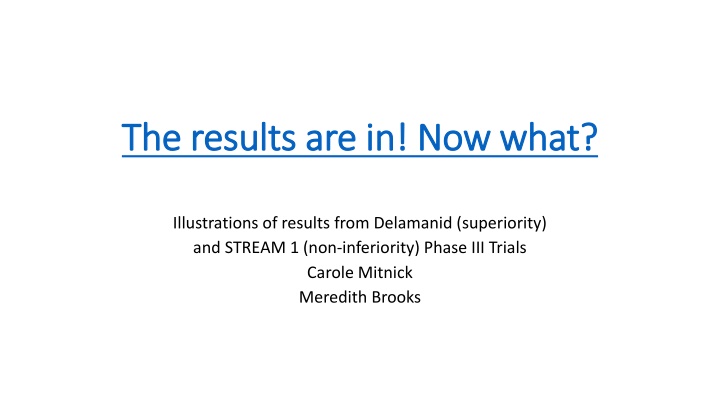
The results are in! Now what? The results are in! Now what? Illustrations of results from Delamanid (superiority) and STREAM 1 (non-inferiority) Phase III Trials Carole Mitnick Meredith Brooks
Superiority Example: Time to conversion 95% CI 95% CI Superior H0: time to conversion is not different between the experimental and control regimens 95% CI Control arm Experimental arm Not superior 95% CI 0 Median days to culture conversion
DLM phase III Results: primary analysis 95% CI Treatment arm (mITT) Control (n=101) Experimental (n=226) Crude difference Days to conversion (95% CI) 57 (56-64) 51 (43-57) 6 days 95% CI 0 Median days to culture conversion P-value 0.056 H0: time to conversion is equal between the experimental and control regimens
Superiority vs. Non-inferiority: risk difference example Inferior Not superior Inconclusive Non- inferior Superior 0 0 10 Difference in unfavorable outcomes between the experimental and control regimens Difference in unfavorable outcomes between the experimental and control regimens H0: difference in unfavorable outcomes between the experimental and control arms=0 HA: difference in unfavorable outcomes between the experimental and control arms<0 H0: difference in unfavorable outcomes between the experimental and control arms>=10 HA: difference in unfavorable outcomes between the experimental and control arms<10
STREAM Results Treatment arm (mITT) Experimental (n=210) Control (n=108) Crude difference % unfavorable outcome 21.9% 19.4% 2.5% Adjusted difference = 10 Conclusion: 95% CI includes (10%), inconclusive for non-inferiority 2.1 (95% CI: -6.9, +11.2) 95% confident that true difference between the control and experimental treatments is between -6.9% and +11.2% 0 H0 (experimental regimen is >= 10% worse than the control), cannot be ruled out
Simplified example of possible algorithm integrating all new treatment modalities for RR/MDR-TB
Rapid molecular (or conventional) test positive for TB and RR/MDR Conventional regimen + 2 of 3: BDQ, LZD, DLM Continue shortened regimen Known (or suspected) R to FQ and/or inject or HIV infected? No Yes Yes Is R documented? No Known R to PZA? >=50% PZA R among FQ-S in jurisdiction? Shortened regimen, pending conventional DST Yes No PZA-R, XDR, pre-XDR among known contacts of patient? No Yes No Conventional regimen + BDQ and/or DLM Known or suspected R to other drugs in shortened regimen? Yes No Yes


