Explore the immediate career plans of dental school seniors post-graduation from 2015 to 2017. The data highlights the distribution of respondents across various professions within the field of dentistry and by race/ethnicity. Gain insights into their career aspirations and choices upon completing their dental education.
Please find below an Image/Link to download the presentation.
The content on the website is provided AS IS for your information and personal use only. It may not be sold, licensed, or shared on other websites without obtaining consent from the author. If you encounter any issues during the download, it is possible that the publisher has removed the file from their server.
You are allowed to download the files provided on this website for personal or commercial use, subject to the condition that they are used lawfully. All files are the property of their respective owners.
The content on the website is provided AS IS for your information and personal use only. It may not be sold, licensed, or shared on other websites without obtaining consent from the author.
E N D
Presentation Transcript
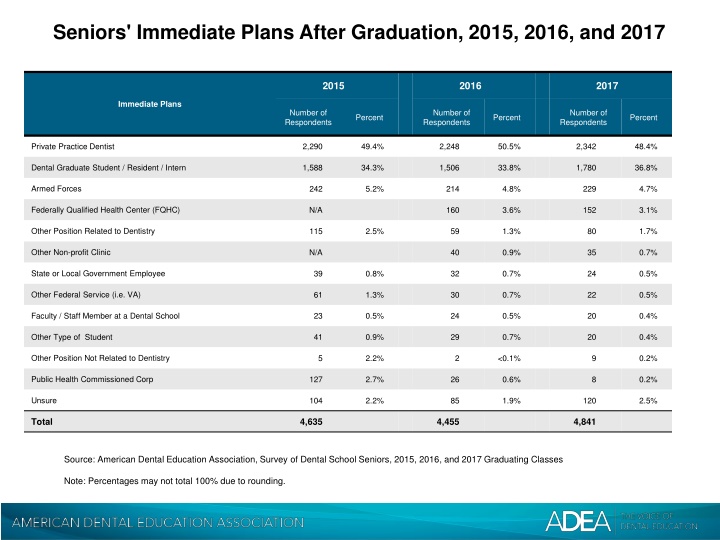
Seniors' Immediate Plans After Graduation, 2015, 2016, and 2017 2015 2016 2017 Immediate Plans Number of Respondents Number of Respondents Number of Respondents Percent Percent Percent Private Practice Dentist 2,290 49.4% 2,248 50.5% 2,342 48.4% Dental Graduate Student / Resident / Intern 1,588 34.3% 1,506 33.8% 1,780 36.8% Armed Forces 242 5.2% 214 4.8% 229 4.7% Federally Qualified Health Center (FQHC) N/A 160 3.6% 152 3.1% Other Position Related to Dentistry 115 2.5% 59 1.3% 80 1.7% Other Non-profit Clinic N/A 40 0.9% 35 0.7% State or Local Government Employee 39 0.8% 32 0.7% 24 0.5% Other Federal Service (i.e. VA) 61 1.3% 30 0.7% 22 0.5% Faculty / Staff Member at a Dental School 23 0.5% 24 0.5% 20 0.4% Other Type of Student 41 0.9% 29 0.7% 20 0.4% Other Position Not Related to Dentistry 5 2.2% 2 <0.1% 9 0.2% Public Health Commissioned Corp 127 2.7% 26 0.6% 8 0.2% Unsure 104 2.2% 85 1.9% 120 2.5% Total 4,635 4,455 4,841 Source: American Dental Education Association, Survey of Dental School Seniors, 2015, 2016, and 2017 Graduating Classes Note: Percentages may not total 100% due to rounding.
Seniors' Immediate Plans After Graduation by Race and Ethnicity, 2015 Native Hawaiian or Other Pacific Islander American Indian or Alaska Native Do Not Wish to Report/ Unknown Black or African American Two or More Races Non- resident Alien Hispanic or Latino Immediate Plans Asian White Private Practice Dentist 40.0% 52.7% 35.4% 49.4% 50.0% 47.8% 40.2% 70.3% 44.9% Faculty / Staff Member at a Dental School 0.0% 1.0% 0.0% 0.3% 0.0% 0.3% 0.8% 0.0% 1.4% Armed Forces 6.7% 2.9% 2.1% 3.9% 5.6% 6.7% 11.5% 0.0% 4.3% Other Federal Service (i.e. VA) 13.3% 1.2% 2.1% 0.9% 5.6% 1.1% 4.1% 0.0% 5.8% State or Local Government Employee 0.0% 0.9% 2.1% 0.6% 0.0% 0.7% 1.6% 1.7% 0.0% Public Health Commissioned Corp 20.0% 1.6% 2.6% 2.4% 0.0% 3.2% 4.1% 1.3% 2.9% Dental Graduate Student / Resident / Intern 32.8% 16.4% 13.3% 33.1% 48.1% 35.8% 22.2% 35.5% 30.4% Other Type of Student 1.6% 0.0% 6.7% 0.9% 1.6% 2.1% 5.6% 0.7% 0.0% Other Position Related to Dentistry 2.5% 5.6% 0.0% 2.8% 1.6% 1.5% 5.6% 2.2% 4.3% Unsure 0.8% 4.7% 0.0% 2.6% 4.2% 2.7% 5.6% 1.6% 5.8% Source: American Dental Education Association, Survey of Dental School Seniors, 2015 Graduating Class Note: Percentages may not total 100% due to rounding.
Seniors' Immediate Plans After Graduation by Race and Ethnicity, 2016 Native Hawaiian or Other Pacific Islander American Indian or Alaska Native Do Not Wish to Report/ Unknown Black or African American Two or More Races Non- resident Alien Hispanic or Latino Immediate Plans Asian White Private Practice Dentist 45.5% 51.3% 34.3% 45.1% 63.6% 51.0% 45.2% 67.0% 52.8% Dental Graduate Student / Resident / Intern 9.1% 34.3% 48.1% 34.2% 18.2% 33.9% 31.9% 19.2% 32.1% Armed Forces 9.1% 2.3% 5.2% 5.6% 9.1% 6.0% 8.9% 0.5% 0.0% Federally Qualified Health Center (FQHC) 9.1% 2.9% 5.2% 5.3% 0.0% 3.6% 3.7% 2.0% 5.7% Other Position Related to Dentistry 0.0% 1.8% 0.0% 1.5% 0.0% 1.2% 0.0% 2.5% 0.0% Other Non-profit Clinic 0.0% 1.4% 1.0% 0.3% 0.0% 0.5% 2.2% 3.0% 3.8% State or Local Government Employee 9.1% 0.8% 0.0% 0.9% 0.0% 0.5% 3.7% 1.0% 0.0% Other Federal Service (i.e. VA) 0.0% 0.5% 1.4% 1.5% 0.0% 0.6% 2.2% 0.0% 0.0% Other Type of Student 0.0% 1.2% 0.5% 0.6% 0.0% 0.5% 0.0% 0.0% 0.0% Public Health Commissioned Corp 0.0% 0.4% 2.4% 1.8% 0.0% 0.4% 0.7% 0.0% 0.0% Faculty / Staff Member at a Dental School 9.1% 0.5% 0.0% 0.3% 0.0% 0.5% 0.7% 1.0% 3.8% Other Position Not Related to Dentistry 0.0% 0.1% 0.0% 0.0% 0.0% 0.0% 0.0% 0.0% 0.0% Unsure 9.1% 2.5% 1.9% 2.9% 9.1% 1.3% 0.7% 3.9% 1.9% Source: American Dental Education Association, Survey of Dental School Seniors, 2016 Graduating Class Note: Percentages may not total 100% due to rounding.
Seniors' Immediate Plans After Graduation by Race and Ethnicity, 2017 Native Hawaiian or Other Pacific Islander American Indian or Alaska Native Do Not Wish to Report/ Unknown Black or African American Two or More Races Non- resident Alien Hispanic or Latino Immediate Plans Asian White Private Practice Dentist 44.4% 48.2% 27.5% 47.0% 50.0% 49.1% 35.3% 70.0% 50.0% Dental Graduate Student / Resident / Intern 22.2% 37.8% 51.7% 37.0% 18.8% 36.3% 45.3% 21.0% 33.3% Armed Forces 0.0% 3.0% 5.8% 4.2% 12.5% 5.8% 5.8% 0.0% 4.8% Federally Qualified Health Center (FQHC) 22.2% 2.4% 3.9% 3.3% 6.3% 3.6% 2.9% 0.9% 1.2% Other Position Related to Dentistry 0.0% 1.8% 2.4% 1.6% 0.0% 1.4% 3.6% 2.1% 1.2% Other Non-profit Clinic 0.0% 0.8% 1.4% 0.7% 0.0% 0.6% 0.0% 0.9% 2.4% State or Local Government Employee 0.0% 0.5% 0.5% 0.7% 0.0% 0.3% 0.0% 1.3% 2.4% Other Federal Service (i.e. VA) 0.0% 0.4% 0.5% 1.2% 6.3% 0.3% 1.4% 0.0% 0.0% Other Type of Student 0.0% 0.5% 0.0% 0.7% 0.0% 0.3% 1.4% 0.0% 1.2% Public Health Commissioned Corp 0.0% 0.1% 0.5% 0.5% 0.0% 0.1% 0.0% 0.4% 0.4% Faculty / Staff Member at a Dental School 0.0% 0.9% 0.0% 0.5% 0.0% 0.2% 0.7% 0.9% 0.0% Other Position Not Related to Dentistry 0.0% 0.3% 0.5% 0.0% 0.0% 0.1% 0.7% 0.9% 0.0% Unsure 11.1% 3.3% 5.3% 2.8% 6.3% 1.8% 2.9% 1.7% 3.6% Source: American Dental Education Association, Survey of Dental School Seniors, 2017 Graduating Class Note: Percentages may not total 100% due to rounding.