Immunohistochemical Stainings of Periampullary Cancers
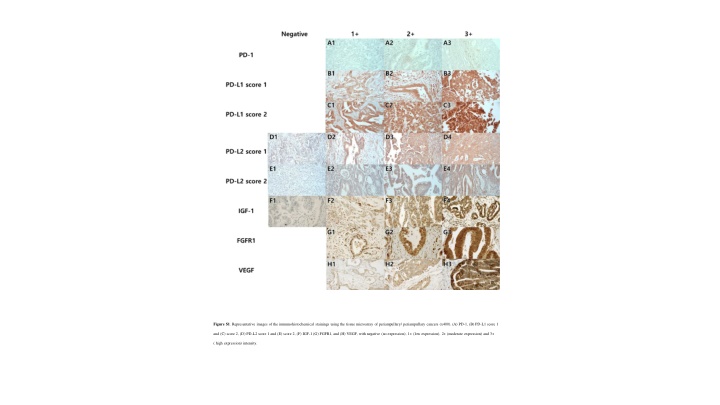
Representative images of immunohistochemical stainings using tissue microarray of periampullary cancers, showcasing expression levels of PD-1, PD-L1, PD-L2, IGF-1, FGFR1, and VEGF. Kaplan-Meier plots illustrating the relationship between overall survival and clinical/pathological parameters in periampullary/pancreatic cancer patients.

Download Presentation

Please find below an Image/Link to download the presentation.
The content on the website is provided AS IS for your information and personal use only. It may not be sold, licensed, or shared on other websites without obtaining consent from the author.If you encounter any issues during the download, it is possible that the publisher has removed the file from their server.
You are allowed to download the files provided on this website for personal or commercial use, subject to the condition that they are used lawfully. All files are the property of their respective owners.
The content on the website is provided AS IS for your information and personal use only. It may not be sold, licensed, or shared on other websites without obtaining consent from the author.
E N D
Presentation Transcript
Figure S1. Representative images of the immunohistochemical stainings using the tissue microarray of periampullary/ periampullary cancers (x400). (A) PD-1, (B) PD-L1 score 1 and (C) score 2, (D) PD-L2 score 1 and (E) score 2, (F) IGF-1 (G) FGFR1, and (H) VEGF, with negative (no expression), 1+ (low expression), 2+ (moderate expression) and 3+ ( high expression) intensity.
A A B P=0.146 P=0.146 P=0.909 P=0.909 Age Age Sex Sex Fem Fem ale ale Age< Age< 60 60 Age>6 Age>6 0 0 Ma Ma le le D C P< P<0 0. .001 001 T0 T0 P<0.001 T T- -7 stage 7 stage P<0.001 Location Location Pancreas<CBD<AOV Pancreas<CBD<AOV AOV AOV T T 1 1 T T 2 2 T T 4 4 T3 T3 CBD CBD Pancreas Pancreas F F E P=0.029 P=0.029 Sessile & Solid Sessile & Solid P<0.001 P<0.001 Size Size Gross type Gross type Infiltrative> Infiltrative>Ulcerofungating Ulcerofungating> >funga ting ting>sessile& solid >sessile& solid funga Fungating Fungating Size<4.5 Size<4.5 Ulcerofungating Ulcerofungating Size>4.5 Size>4.5 Infiltrative Infiltrative H G P<0.001 P<0.001 P<0.001 P<0.001 N stage N stage M stage M stage N N 0 0 M M 0 0 N N 1 1 M M 1 1 Figure S2. Kaplan-Meier plots on the relationship between overall survival and clinical parameters in periaullary/pancreatic cancer patients. No significant relationship found according to (A) age and (B) sex, whereas there was significant difference according to (C) location, (D) T stage, (E) gross type, (F) size, (G) N stage, and (H) M stage. mp
A A B P=0.003 P=0.003 P<0.001 P<0.001 Vascular Invasion Vascular Invasion Lymphatic Invasion Lymphatic Invasion Absent Absent Absen Absen t t Present Present Presen Presen t t D C P=0.096 P=0.096 P<0.001 P<0.001 Perineural Invasion Perineural Invasion Radial margin involvement Radial margin involvement Absent Absent Absent Absent Present Present Present Present F F E P=0.007 P=0.007 P=0.002 P=0.002 Pancreatobillary Pancreatobillary/ / intestinal subtype intestinal subtype Histological differentiation Histological differentiation Intestinal subtype Intestinal subtype Well differentiated Well differentiated Prone to intestinal subtype Prone to intestinal subtype Moderately differentiated Moderately differentiated Prone to Prone to pancreatobiliary pancreatobiliary Pancreatobiliary Pancreatobiliary subtype subtype Poorly differentiated Poorly differentiated G H Absent Absent P=0.001 P=0.001 P=0.063 P=0.063 Inflammation Inflammation Fibro sis Sever Sever e e Mild Mild Moderate Moderate Moderat Moderat e e Fibrosis Severe Severe Abse Abse nt nt Figure S3. Kaplan-Meier plots on the relationship between overall survival and the pathological parameters in the periampullary/pancreatic cancers patients. There was significant relationship according to (A) lymphatic invasion, (B) vascular Invasion, (C) perineural invasion, (E) histological differentiation, (F) pancreatobillary/intestinal type, and (G) fibrosis, while there was no significant difference according to (D) radial margin involvement, and (H) inflammation.
B A A P=0.029 P=0.029 P<0.001 P<0.001 CK20 CK20 CDX2 CDX2 3 3 + + 3 3 + + 2 2 + + 1 1 + + 2 2 + + 1 1 + + 0 0 0 0 C D P<0.001 P<0.001 P=0.03 P=0.03 FGFR FGFR- -1 1 VEGF VEGF 3+ 3 3 + + 2 + 2 2 + + 1+ 1+ 1+ Figure S4. Kaplan-Meier plots survival analysis on the relationship between overall survival and expression level of the IHC markers in periampullary/pancreatic cancers patients. There was significant relationship according to (A) CK20, (B) CDX2, (C) FGFR1, and (D) VEGF,
B A A P=0.061 P=0.898 P=0.898 Age Age Sex Sex Age<74 Age<74 Fem Fem ale ale Age>7 Age>7 4 4 M M al al e e C D T0 T0 P=0.119 P=0.119 P<0.006 Location Location Pancreas<CBD<AOV Pancreas<CBD<AOV P<0.006 T stage T stage A A O O V V T 4 T T 1 1 T T 2 2 Pancreas Pancreas T T 3 3 C C B B D D E F F Sessile & Solid Sessile & Solid P=0.236 P=0.236 P=0.045 P=0.045 Gross type Gross type Ulcerofungating> >f f ungating ungating>sessile& solid >sessile& solid Infiltrative> Infiltrative>Ulcerofungating Size Size Fungati Fungati ng ng Ulcerofungating Ulcerofungating Size< Size< 1.5 1.5 Infiltrati Infiltrati ve ve Size>1 Size>1 .5 .5 G H P<0.001 P<0.001 P=0.226 P=0.226 M M 1 1 N stage N stage M stage M stage N N 0 0 M M 0 0 N N 1 1 Figure S5. Kaplan-Meier plots on the relationship between disease free survival and clinical parameter in recurrent Periampullary/Pancreatic cancers patients. There was significant no relationship according to (A) age, (B) sex, (E) gross type, and M stage.While there was significant relationshipaccording to, (C) location, (D) T stage, (F) Size, and (G) N stage.
B A A P<0.001 P<0.001 P=0.209 P=0.209 Lymphatic Invasion Lymphatic Invasion Vascular Invasion Vascular Invasion Abs Abs ent ent Abs Abs ent ent Present Present Prese Prese nt nt D C P=0.055 P=0.055 P=0.215 P=0.215 Perineural Invasion Perineural Invasion Radial margin involvement Radial margin involvement Abse Abse nt nt Presen Presen t t Abse Abse nt nt Presen Presen t t F F E P=0.0902 P=0.0902 P=0.001 P=0.001 Pancreatobillary Pancreatobillary /intestinal subtype /intestinal subtype Histological differentiation Histological differentiation Intestinal Intestinal subtype subtype Prone to intestinal subtype Prone to intestinal subtype Well differentiated Well differentiated Prone to Prone to pancreatobiliary pancreatobiliary Moderately differentiated Moderately differentiated Pancreatobiliary Pancreatobiliary subtype subtype Poorly differentiated Poorly differentiated H G P=0.806 P=0.806 Absent Absent P=0.005 P=0.005 Inflammation Inflammation Fibro Fibro sis sis Mil Mil d d Severe Severe Moder Moder ate ate Moderate Moderate Absent Absent Severe Severe Figure S6. Kaplan-Meier plots on the relationship between disease free survival and pathological parameter in recurrent Periampullary/Pancreatic cancers patients . There was significant relationship according to (A) lymphatic invasion, (E) histological differentiation, and (G) fibrosis, whereas there was no significant difference according to (B) vascular Invasion, (C) perineural invasion, (D) radial margin involvement, (F) pancreatobillary type vs intestinal type, and (H) inflammation.
A A B P=0.384 P=0.384 P=0.025 P=0.025 CDX2 CDX2 CK20 CK20 3 3 + + 3 3 + + 2 2 + + 2 2 + + 1 1 + + 1 1 + + 0 0 0 0 D C P=0.188 P=0.188 P=0.007 P=0.007 VEGF VEGF FGFR FGFR D . 3 3 + + 3 3 + + 2 2 + + 2 2 + + 1 1 + + 1 1 + + Figure S7. Kaplan-Meier plots on the relationship between disease free survival analysis and IHC markers expression level in recurrent Periampullary/Pancreatic cancers patients. There was significant relationship according to (A) CK20, (B) CDX2, and (C) FGFR1 and, whereas there was not significant difference according to (D) VEGF.