Impact of an Excise Tax on Ferry Crossings
Explore how the imposition of a $20 excise tax affects the market equilibrium price and quantity of ferry crossings, leading to changes in consumer behavior, tax revenue distribution, and deadweight loss. Discover insights into the dynamics of supply, demand, and tax implications in this economic scenario.
Download Presentation

Please find below an Image/Link to download the presentation.
The content on the website is provided AS IS for your information and personal use only. It may not be sold, licensed, or shared on other websites without obtaining consent from the author. If you encounter any issues during the download, it is possible that the publisher has removed the file from their server.
You are allowed to download the files provided on this website for personal or commercial use, subject to the condition that they are used lawfully. All files are the property of their respective owners.
The content on the website is provided AS IS for your information and personal use only. It may not be sold, licensed, or shared on other websites without obtaining consent from the author.
E N D
Presentation Transcript
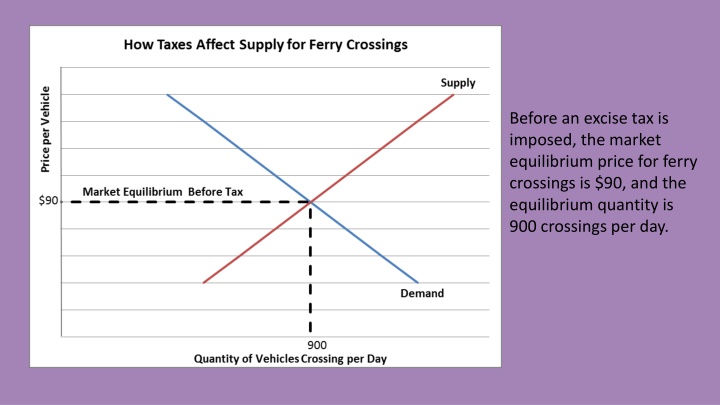
Before an excise tax is imposed, the market equilibrium price for ferry crossings is $90, and the equilibrium quantity is 900 crossings per day.
Assume the government imposes a $20 excise tax. The supply curve for Maritime Ferry would decrease, or shift to the left. Maritime s cost increases by $20 for every vehicle, so there is a parallel shift upward by $20.
Initially, Maritime Ferry would try to pass this cost through to its customers and increase its price from $90 to $110 per car. At $110, Maritime Ferry would still be willing to supply 900 ferry crossings per day. However, customers would only be willing to buy 700 crossings per day, resulting in a daily surplus of 200 crossings!
Eventually, a new equilibrium price and quantity would be reached at a price of $100 per ticket and a quantity of 800 ferry crossings per day.
The tax revenue is represented by the blue and green shaded areas and is equal to $16,000 ($20 tax x 800 ferry crossings).
The blue shaded area shows the portion of the tax that Maritime s customers pay in the form of $10 more per crossing ($100 instead of $90). At 800 crossings per day, consumers pay $8,000 ($10 tax x 800 ferry crossings) in taxes.
The green shaded area shows the portion of the tax that Maritime Ferry pays. Consumers pay $100 per crossing, which is $10 more than the equilibrium price before the tax. However, Maritime Ferry must pay the government $20 of that $100, so its actual revenue per crossing is only $80. The company incurs a loss of $10 per crossing from what it would have been paid before the tax. Therefore, the total tax paid by Maritime Ferry is equal to $8,000 ($10 tax X 800 ferry crossings).
Finally, the excise tax causes a deadweight loss that is measured by the loss of production and a higher price when the tax alters the market equilibrium. The tax pushes the equilibrium price from $90 to $100, and there is a cost to society of 100 fewer ferry crossings. This loss is shown as Triangle BDE.

