Impact of Bomb Cyclone of 2018 on Boston, MA
The Bomb Cyclone of 2018 brought knee-deep snow from North Carolina to Maine, causing historically significant amounts in Florida, Georgia, and South Carolina. Boston faced record-high water levels, extreme winds, and frigid temperatures. A survey revealed local TV news as the top source for severe weather information in Boston. Residents trust broadcast stations during weather crises. The research methodology involved 796 interviews in the Boston DMA.

Download Presentation

Please find below an Image/Link to download the presentation.
The content on the website is provided AS IS for your information and personal use only. It may not be sold, licensed, or shared on other websites without obtaining consent from the author. If you encounter any issues during the download, it is possible that the publisher has removed the file from their server.
You are allowed to download the files provided on this website for personal or commercial use, subject to the condition that they are used lawfully. All files are the property of their respective owners.
The content on the website is provided AS IS for your information and personal use only. It may not be sold, licensed, or shared on other websites without obtaining consent from the author.
E N D
Presentation Transcript
Weather Emergency Survey The Bomb Cyclone of 2018, & its Impact on Boston, MA
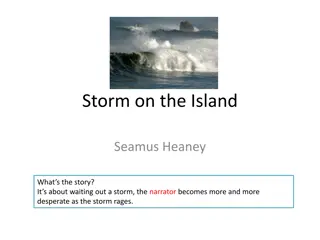
The Bomb Cyclone of 2018 Snow The storm not only produced knee-deep snow from North Carolina to Maine, but also some historically significant amounts in Florida, Georgia and South Carolina. Wind Winds roared, reaching 50 to 80 mph along the coast in the Northeast. Water Like a hurricane storm surge, the storm s enormous circulation and winds pushed a large amount of seawater inland. Boston set its highest water level on record, narrowly exceeding the level reached during the blizzard of 1978. Temperature As regions like Boston began cleanup, frigid temperatures rapidly descended upon the region. Boston firefighters wade through a street flooded from tidal surge during Storm Grayson in Boston, Massachusetts, U.S., January 4, 2018. Reuters 2
TVB and Research Now The results of this Boston survey mirror the findings of previous severe weather-related surveys, including Hurricanes Harvey & Irma. The main information source for residents in a time of crisis and the most trusted is their local broadcast television station. 3
Research Overview: Methodology WHO: 796 interviews were collected via opt-in sample. To qualify respondents needed to be age 18+ and: Reside in the Boston (Manchester) DMA. Had seen or heard any information or coverage of the approaching severe weather on any media platform. Had to be in their own home and have electricity at the time of the survey (about 2% were not). WHEN: Interviews began Friday morning, January 5th, and concluded Saturday morning, January 6th, 2018. WHAT: A short online survey about respondents news media habits regarding the severe weather. Respondents were asked about their media usage the previous day, from 6 a.m. to 12 midnight. Please note that to avoid any confusion between broadcast and cable, broadcast stations were delineated by call letters and channel numbers, with separate questions for cable networks/channels. 4 Source: Research Now Weather Survey. 1/5-1/6/18 Adults 18+.
Local TV News Tops for Severe Weather Information Which of these sources did you watch, listen to or go to for information about the approaching severe weather conditions? 97% 48% 41% 35% 34% 28% 26% 25% 21% 16% 16% 11% 6% Local TV News Program Social Media Local TV Station's Website National TV News Program Radio Digital Version of a Newspaper Website All Other Internet Use on the Computer Newspapers Cable News Cable News Channel's Website Broadcast TV Network's Website Online News Aggregator or Blog Website Radio Website Network 5 Source: Research Now Weather Survey. 1/5-1/6/18 Adults 18+.
Adults 18+ Spent Most Time with Local TV News Assets Time Spent Yesterday A18+ (In Hours:Minutes) Local TV News Social Media National TV News Radio Broadcast Internet Radio Broadcast Cable TV News Local TV News Website/App 3:37 0:55 0:46 0:44 0:40 0:32 0:22 Newspaper 0:21 Newspaper Website/App National TV News Website/App 0:17 0:16 Other Internet 0:12 Cable News Website/App Blog Website Radio Website/App 0:09 0:05 0:04 6 Source: Research Now Weather Survey. 1/5-1/6/18 Adults 18+. Time Spent between 6 a.m. and 12 midnight
Local TV Station News Tops For Severe Weather Preparation Information When facing severe weather approaching your city/town/region, which source do you feel gives you the best information on how to prepare (e.g. emergency procedures, traffic information, closures)? 69% 22% 19% 18% 17% 16% 12% 10% 9% 7% 6% 6% 5% Local Broadcast Television Station News Cable News Channels Social Media Websites or Radio Stations Broadcast Network National News Telecasts Local Websites or Apps of National or Local Newspapers All Other Internet News Websites or Apps of Cable TV News Websites or Apps of National Broadcast TV News Websites or Apps of Radio Stations National Newspapers Apps of Local TV News Newspapers 7 Source: Research Now Weather Survey. 1/5-1/6/18 Adults 18+.
Local TV News Skewed Younger than Cable Network News Local TV News Program Audience Composition Cable News Network Audience Composition A18-54 58% A55+ 54% A18-54 46% A55+ 42% 8 Source: Research Now Weather Survey. 1/5-1/6/18 Adults 18+.
Local TV News: #1 For Trust Websites/Apps for Local TV News Tops for Digital For each source, please indicate the extent to which you agree or disagree with the following statement: I trust the news that I see/hear on this media source 84% Top 2 Boxes 69% 69% 67% 67% 64% 61% 56% 53% 53% 53% 43% 36% Local Broadcast TV News Broadcast Network National News Local Websites or Apps of Local TV News Radio Stations Cable News Channels Websites or Apps of National or Local Newspapers Websites or Apps of National Broadcast TV News Websites or Apps of Cable TV News Websites or Apps of Radio Stations National Newspapers All Other Internet News Social Media Newspapers 9 Source: Research Now Weather Survey. 1/5-1/6/18 Adults 18+. Top 2 boxes = Agree Strongly and Agree Somewhat
Why Local TV? What are your reasons for watching local TV news during this dangerous weather time? I want information that pertains to the area I live in 68% I like that they are constantly updating and giving latest information 58% I want to know the status of public services e.g. school closings, road conditions public transit, shelters I want to know the 56% I like that they visually show areas affected 48% I like that they are reporting from different neighborhoods in my area 40% I feel my local broadcast station is looking out for what I need to know and will keep me safe 43% I trust the news from my local station 47% 10 Source: Research Now Weather Survey. 1/5-1/6/18 Adults 18+.
Why Local TV News Website/Apps? What are your reasons for using local TV news websites/apps during this dangerous weather time? I want to know the status of public services e.g. school closings, road conditions public transit, shelters 48% I like that they are constantly updating and giving me the latest information 51% I I like that I can access it wherever I am 44% I like that I can get information I need on my timetable 43% I like getting the alerts 34% I trust the news from my local broadcast stations website/app 34% 11 Source: Research Now Weather Survey. 1/5-1/6/18 Adults 18+.
Key Points News Sources: 97% of respondents used local TV news for information about the storm. Time Spent: At 3 hours and 37 minutes, respondents spent more time with local television than any other source, nearly four times more than time spent with the 2nd highest platform. Local TV News Skewed Younger than Cable TV: 58% of the local TV news audience fell between the ages of 18 and 54, compared to just 46% for cable network news. Information Source: 69% of respondents chose local TV for information when facing severe weather. Trust: Local TV news was the most trusted source for coverage and information (84% of respondents agreed). Local TV digital assets were the most trusted digital source at 67%. Social media was the lowest at 36%. The top reason cited for watching local TV news was that respondents wanted information that pertained to their area. The top reason for using local TV news websites and apps was for constant updates and latest information. 12