Impact of Chinese Capital on Australian House Prices
The research explores the impact of Chinese capital flight on Australian housing prices, challenging the perception that Chinese buyers are solely responsible for driving up the market. It delves into the complexity of distinguishing local from foreign buyers and the various channels through which Chinese capital flows into the Australian real estate market.
Uploaded on Mar 14, 2025 | 1 Views
Download Presentation

Please find below an Image/Link to download the presentation.
The content on the website is provided AS IS for your information and personal use only. It may not be sold, licensed, or shared on other websites without obtaining consent from the author.If you encounter any issues during the download, it is possible that the publisher has removed the file from their server.
You are allowed to download the files provided on this website for personal or commercial use, subject to the condition that they are used lawfully. All files are the property of their respective owners.
The content on the website is provided AS IS for your information and personal use only. It may not be sold, licensed, or shared on other websites without obtaining consent from the author.
E N D
Presentation Transcript
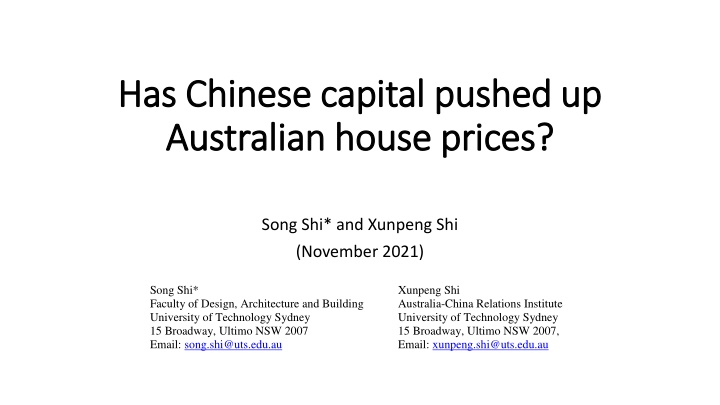
Has Chinese capital pushed up Has Chinese capital pushed up Australian house prices? Australian house prices? Song Shi* and Xunpeng Shi (November 2021) Song Shi* Faculty of Design, Architecture and Building University of Technology Sydney 15 Broadway, Ultimo NSW 2007 Email: song.shi@uts.edu.au Xunpeng Shi Australia-China Relations Institute University of Technology Sydney 15 Broadway, Ultimo NSW 2007, Email: xunpeng.shi@uts.edu.au
Chinese Buyers and Australian Housing Market Chinese buyers are the fastest-growing segment of global property buyers. They spent US$100 billion on international residential and commercial properties in 2016, and were predicted to spend US$220 billion in 2020 (Juwai, 2017) Chinese buyers are being blamed for pushing up local housing prices in Australia. However, that claim contradicts to the fact: Only about 2% of NSW home buyers PAID the foreign buyer surcharge in 2016. The current border restrictions have reduced foreign buyers' overall market share from the pre-pandemic 7-13% to 4% in new property markets (Gradwell, 2017; Wakelin, 2021). Among all foreign buyers, Chinese accounted for about 30% of them (Gradwell, 2017).
The Challenge In Foreign Investment Studies Distinguishing local from foreign buyers in the market. A recent survey found that more than 80% of Australians blame Chinese investors for rising house prices, even after a year of closed borders, when data showed that foreign property investment fell to record lows (Zhou, 2021). The majority of Chinese buyers in the Australian housing market (resales market) were indeed local (domestic-Chinese or permanent residents) rather than foreign Chinese citizens.
Motivation Of This Research Rather than distinguishing buyers, we studied this issue through the lens of capital flight by Chinese who rely on their savings in China to purchase real estate overseas. Australia is a migration country. Like many other migrant countries, migrants in Australia congregate in metropolitan areas such as Sydney and Melbourne and form their ethnic communities in urban settlements. These migrant communities maintain close connections to their home countries and play a key role in bringing business, international students and capital into Australia. There has been massive capital flight from China to other countries each year.
Chinese Capital Flight Is Through Various Channels. Wong (2017) found that Chinese households made their real estate purchases abroad through travel (tourism or education). According to Juwai, education is the chief motivation behind Chinese people purchasing real estate abroad (Juwai, 2015); they buy their children a place when they are studying overseas. Other factors include immigration, retirement, a holiday home or investment. Chinese migrants overseas can get access through their savings in China and spend it overseas using AliPay, WeChat or UnionPay. For the large sums of money required for real estate purchases, they may pool their relatives or friends credit cards or request family members to transfer the money to their overseas account. Sometimes Australian-Chinese use underground banks to deal with foreign exchange or hold properties on behalf of foreign citizens.
Limitation On Currency Transactions (LCT) On 30 December 2016, the People's Bank of China (PBOC) published "Administrative Measures on Reporting for Large-Value Transactions and Suspicious Transactions in Financial Institutions" (The People's Bank of China, 2016). The order took effect on 1 July 2017 Banks enhanced their procedures to validate and authenticate personal foreign currency conversion transactions and monitor compliance by requesting individuals to complete detailed questionnaires. The foreign currency conversion quota was capped at US$50,000 per annum, and purchasing foreign property or investment in securities was explicitly prohibited.
We Find: Using propensity score matching and difference-in-difference techniques, we found that the limitation on currency transition (Order No.3) issued by the People s Bank of China (PBOC) in 2016 had a profound price impact (-2%) on the Sydney housing market, particularly in Chinese neighbourhoods (-4.5%). We therefore present empirical evidence that Chinese capital is closely linked to the Australian housing market.
Empirical Analysis ln ???? = ?0+ ?1????+ ?2???+ ?3???? ???+ ??????? ? ????????????????+ ?????????+ ????+ ??????+ ????????+ ??? where ???? is the jth property s sale price in suburb s at time t, ???? is the policy dummy which equals 1 for sales after 1 July 2017 and 0 otherwise, ??? is Chinese population in the suburb s measured by percentages or dummy variables, ???????? ???????????????? is the jth property s physical attributes, including number of bedrooms and bathrooms, car space and garaging, land area and property type (house or unit), ????????? is the suburb amenities for the jth property, including driving time to the CBD and population density in suburb s, ???? is the location fixed effect at a LGA level, ?????? is a calendar year dummy, ???????? is a monthly dummy for seasonal effects, and ??? is the error term.
Residential Sales in the Sydney Metropolitan Area, 2016-2018 Maximum Minimum 355,000 1.000 1.000 1.000 0.000 Std. Dev. 729,176 1.066 0.739 0.753 0.685 1,793 0.486 Observations 90,945 90,945 90,945 90,945 90,945 90,945 90,945 Sale price (AUD) No. of bedrooms No. of bathrooms No. of car spaces No. of lockup garage Land area (sqm) Property type (house -0, unit-1) Mean 1,155,355 3.151 1.728 1.642 1.525 1,215 0.382 Median 900,000 5,120,000 3.000 2.000 2.000 1.000 656 0.000 6.000 4.000 5.000 4.000 19,600 1.000 67 0.000 Residential property sale data was provided by the Rozetta Institute (formerly the Securities Industry Research Centre of Asia-Pacific (SIRCA)) on behalf of CoreLogic.
Suburbs In The Sydney Metropolitan Area Maximum 50.00 43.27 100.00 26.32 75.00 100.00 100.00 47.50 46.23 50.00 33.91 54.52 72.00 Minimum Std. Dev. Observations Chinese population (%) Tertiary education (%) Australian citizen (%) Married de facto (%) Employed full time (%) Speak English and other languages (%) Speak other languages at home (%) Different address 5 years ago (%) New immigrants between 2011 and 2016 (%) Owning outright (%) Renting (%) Occupied private dwelling (%) Median age (years) Average household size (no. of person) Median weekly rent (AUD) Median monthly mortgage payment (AUD) Travel time to the CBD (minute) Population Area (sq km) Mean Median 3.63 5.41 80.96 6.30 30.98 21.37 30.27 6.28 5.75 10.53 9.88 32.46 38.33 2.82 467.62 2,342.77 2,349.50 37.47 6,455 8.18 1.61 4.91 84.46 5.25 31.10 17.71 25.29 4.34 3.91 10.79 8.02 31.97 38.00 2.90 450.00 0.00 0.00 0.00 0.00 0.00 0.00 0.00 0.00 0.00 0.00 0.00 0.00 0.00 0.00 0.00 0.00 0.00 3.00 0.10 5.49 4.12 12.30 3.74 7.38 16.18 21.06 6.76 6.53 4.57 6.86 6.15 6.23 0.51 180.13 665.77 18.76 6,589 26.09 678 678 678 678 678 678 678 678 678 678 678 678 678 678 678 678 678 678 678 3.90 1,500.00 5,200.00 152.00 47,176 524.00 36.00 4,469 2.74 The suburb population profile data was obtained from the Australian Bureau of Statistics (ABS) 2016 census.
Distributions Of Chinese Suburbs Chinese population [0, 0.05) [0.05, 0.1) [0.1, 0.15) [0.15, 0.2) [0.2, 0.25) [0.25, 0.3) [0.3, 0.35) [0.35, 0.4) [0.5, 0.55) Total Mean Median New South Wales Count Percent 4,170 88 42 12 7 3 2 2 1 4,327 Sydney Metro Area Count Percent 528 81 42 12 7 3 2 2 1 678 96.37 2.03 0.97 0.28 0.16 0.07 0.05 0.05 0.02 100 0.65 0.00 77.88 11.95 6.19 1.77 1.03 0.44 0.29 0.29 0.15 100 3.63 1.61
OLS Regressions Of Chinas LCT On The Sydney Housing Market Dependent variable: log of sale price Constant (1) (2) (3) (4) (5) (6) 13.625 *** (0.017) -0.022 *** (0.003) 13.621 *** (0.017) -0.010 ** (0.004) 0.140 *** (0.023) -0.270 *** (0.027) 13.617 *** (0.017) -0.013 *** (0.003) 13.623 *** (0.017) -0.017 *** (0.003) 13.641 *** (0.017) -0.019 *** (0.003) 13.630 *** (0.017) -0.021 *** (0.003) Limitation on currency transactions (LCT) Suburbs of Chinese population % Suburbs of Chinese population %*LCT Suburbs of Chinese population above 5% 0.021 *** (0.003) -0.031 *** (0.003) Suburbs of Chinese population above 5% *LCT Suburbs of Chinese population above 10% 0.015 *** (0.003) -0.033 *** (0.005) Suburbs of Chinese population above 10% *LCT Suburbs of Chinese population above 15% 0.067 *** (0.005) -0.050 *** (0.007) Suburbs of Chinese population above 15% *LCT Suburbs of Chinese population above 20% 0.029 *** (0.006) -0.033 *** (0.009) Suburbs of Chinese population above 20% *LCT
Chinese Suburbs Based On The PSM In total, there are 580 matched suburbs left in this study We followed the four steps below in the PSM testing: 1) Choose the covariates that predict a suburb is a Chinese or non-Chinese suburb. 2) Employ a logistic model to investigate the impact of these covariates on Chinese location choices. 3) Conduct a nearest neighbour search. 4) Conduct the analysis using the matched sample.
OLS Results Based On The Propensity Score Matching (PSM) Dependent variable: log of sale price Constant (1) (2) (3) (4) 13.481 *** (0.033) -0.020 *** (0.005) 13.480 *** (0.033) -0.003 (0.005) 0.152 *** (0.081) -0.692 *** (0.117) 13.472 *** (0.033) -0.015 ** (0.005) 13.483 *** (0.033) -0.020 *** (0.005) Limitation on currency transaction (LCT) Suburbs of Chinese population % Suburbs of Chinese population %*LCT Suburbs of Chinese population above 5% 0.033 *** (0.005) -0.030 *** (0.008) Suburbs of Chinese population above 5% *LCT Suburbs of Chinese population above 10% 0.022 ** (0.010) -0.028 * (0.015) Suburbs of Chinese population above 10% *LCT
Robustness Checks Regressions with Placebo treatments NSW non-Chinese Suburbs Randomly assigning Chinese suburbs Regressions of top Chinese suburbs with a market consensus The most Chinese residents from 2020 Sydney Suburb Reviews Report from real estate agents on the most popular suburbs for Chinese buyers in 2018 Group the Sydney metropolitan area into five main regions based on the Greater Sydney Region Plan to account for the different time trends. Restricting the sample by distance to the CBD. We did not carry out a yearly pre-treatment trend testing as our testing period was short (one year before and after the policy shock).
Conclusions 1. Our results shows that Chinese capital was closely linked to the Australian housing market. 2. As foreign investment is restricted to new housing purchases in Australia, our results from the resale market suggested that domestic Chinese buyers were playing an important role in the Australian housing market. 3. Evidence from a real estate executive also showed that the buyers were dual citizens or permanent residents who conducted business in Australia and contributed to the country (Hall, 2020). 4. Lastly, it is perfectly normal that Chinese migrants maintain a close economic relationship with China and use their Chinese savings to purchase real estate overseas for meeting their living or investment requirements abroad. The phenomenon is not just for Australia but has also been seen in other migrant countries.
