Impact of COVID-19 on Homelessness: Insights and Strategies
Explore the effects of COVID-19 on Continuums of Care (CoCs) and the state of homelessness, along with strategies for the future. Dive into data sources, utilization of PIT counts, HMIS data, racial equity considerations, and more to enhance responses to homelessness challenges.
Download Presentation

Please find below an Image/Link to download the presentation.
The content on the website is provided AS IS for your information and personal use only. It may not be sold, licensed, or shared on other websites without obtaining consent from the author. If you encounter any issues during the download, it is possible that the publisher has removed the file from their server.
You are allowed to download the files provided on this website for personal or commercial use, subject to the condition that they are used lawfully. All files are the property of their respective owners.
The content on the website is provided AS IS for your information and personal use only. It may not be sold, licensed, or shared on other websites without obtaining consent from the author.
E N D
Presentation Transcript
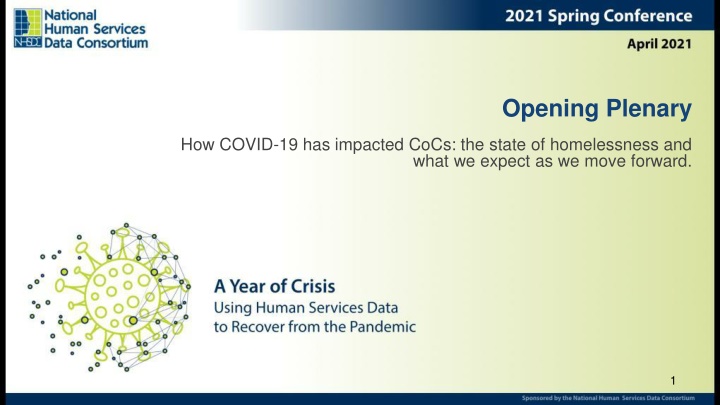
Opening Plenary How COVID-19 has impacted CoCs: the state of homelessness and what we expect as we move forward. 1
Agenda Welcome to NHSDC! Welcoming remarks, Norm Suchar Community Presentations Santa Clara County, CA Boston, MA Montgomery County, MD Questions & Answers
Data Sources PIT count Homeless Management Information System (HMIS) System Performance Measures Annual Performance Report (APR) Consolidated Annual Performance and Evaluation Reports (CAPER) Coordinated Entry System (might be HMIS or another database) Active or By Name Lists (BNL) Department of Education data
With COVID-19, How Do I Use the PIT Count Data? Use 2020 as the baseline 2021 HIC and sheltered PIT count Use it to tell your response story Did you use NCS? What did shelter decompression look like? Did your shelter numbers change from the past? What caused that? (more seeking assistance in general? more unsheltered engagement? Etc) Racial equity do the proportions of services reflect services from the past? 2021 unsheltered PIT count If you did a count, what did you do different? Did the count give you a sense of what general direction unsheltered homelessness is going in your CoC? If you did not do a count, what did you learn from your existing response? Is street outreach still engaged? How else are you learning about the unsheltered population?
With COVID-19, How Do I Use the HMIS Data? We generally get our data on homelessness from the following sources: PIT count Homeless Management Information System (HMIS) System Performance Measures Annual Performance Report (APR) Consolidated Annual Performance and Evaluation Reports (CAPER) Coordinated Entry System (might be HMIS or another database) Active or By Name Lists (BNL) Department of Education data
With COVID-19, How Do I Use the HMIS Data? Are you maintaining strong data quality checks still? Did the system performance change in ways you predicted? Average length of time homeless Exits to permanent housing Returns to homelessness First time homeless Have you looked at race and other demographic data for these populations? Are you sharing what you are learning with CoC membership and other stakeholders?
With COVID-19, How Do I Use the Other Homeless Data? Coordinated entry system This is likely your best source on people presenting for homelessness What does the data tell you about who is coming in? What do people need? Do you have diversion efforts and if so, what do you see working from that? Active or By Name List Similar to above what has changed about who is presenting for the first time? Department of Education data Have you been talking to schools about trends they are seeing? How has COVID-19 impacted their data collection?
Other Data Opportunities There are other opportunities that COVID-19 presents COVID-19 testing data COVID-19 vaccination data Census data what to expect about who might need homeless assistance What partnerships could lead to greater system integration in the future? Hospitals Justice system
Assisting Vulnerable Santa Clara County Residents during the COVID-19 Pandemic Chad Bojorquez, Destination: Home Darcie Green, Latinas Contra Cancer Lee Clark, Lived Experience Advisory Board 9
Destination: Home A public-private partnership preventing and ending homelessness in Silicon Valley Through our collective impact model, we incubate new ideas, advocate for policies, and fund impactful strategies that address the root causes of homelessness and help ensure that our most vulnerable neighbors have a stable home. 10
Financial & Rental Relief in Santa Clara County Relief effort launched on March 23, 2020 as an extension of our countywide Homelessness Prevention System. Leveraged a combination of public and private funding (roughly 50/50) Deployed assistance in partnership with 70 non-profits and community groups Evolved over the past 12 months to respond to the shifting needs and dynamics in our community Over the past year, we have provided $36 million to 15,000 households in-need. 11
Financial & Rental Relief in Santa Clara County 1) Prioritizing Limited Resources for the Greatest Impact Data-Informed Insights Initial funding oversubscribed in 72 hours, almost exclusively via online applications. During Phase 1, we ultimately saw 3x more residents applied than we could assist. The majority of applicants were Extremely Low Income residents and People of Color. Key Takeaway: Rent Relief programs must prioritize our lowest-Income & most vulnerable residents and take intentional steps to reach them. 12
Financial & Rental Relief in Santa Clara County 2) Addressing the Enormous Level of Need Among Vulnerable Residents Data-Informed Insights The ELI residents served during our most recent phase have seen their income drop by 2/3. The average household owed appx. $5K in back rent. One partner reported that 66% of their clients borrowed (and still owed) money as a result of the pandemic. Key Takeaway: Assistance must be substantive and flexible enough to truly help a family or individual resolve their challenges. 13
Financial & Rental Relief in Santa Clara County 3) Removing Barriers to Accessing Assistance Data-Informed Insights More than 1/3 of residents we served faced some form of challenge providing documentation re: to their loss of income or living situation. In close to 40% of cases, we were unable to connect with a landlord to accept a rental assistance payment. Key Takeaway: Rent Relief programs must avoid too strict or onerous requirements and provide flexibility to address non-traditional situations. 14
Financial & Rental Relief in Santa Clara County Darcie Green, Latinas Contra Cancer Latinas Contra Cancer is a leading service and advocacy organization for Latinos around issues of cancer. Our mission is to create an inclusive health care system for Latinos around issues of breast and other cancers. Latinas Contra Cancer has been one of the key partners helping implement financial and rental relief in Santa Clara County. 15
Assisting Santa Clara Countys Unsheltered Residents In response to the pandemic, our local Continuum of Care led by the County of Santa Clara & City of San Jose quickly mobilized to assist our unsheltered neighbors: Opened several new temporary shelters and hotel/motel sites to add hundreds of temporary housing and shelter units to our inventory. Referred more than 4,000 vulnerable homeless individuals to congregate or non- congregate shelter. Vastly expanded outreach and services to individuals living in encampments. 16
Assisting Santa Clara Countys Unsheltered Residents Using Data to Inform Our Outreach & Services to Encampments Utilized City of San Jose encampment data to identify large encampments where services were most in-need and could be delivered efficiently. Local food desert maps were used to prioritize Meal/Water delivery efforts. Collaborated with Valley Homeless Healthcare Program, Lived Experience Advisory Board, and volunteers to pool information gathered during encampment visits. 17
Assisting Santa Clara Countys Unsheltered Residents The Collective Impact of Our Work in Encampments Initiated regular delivery of supplies - including meals, water, tents, hand sanitizer, solar phone chargers and PPE - to dozens of encampments across the city. Provided mobile shower, handwashing stations, portable toilets and garbage collection services at ~20 large homeless encampments. Building off these efforts, the City of San Jose has launched a new SOAR program to provide ongoing hygiene services and intensive street outreach at some of its largest encampments. 18
Assisting Santa Clara Countys Unsheltered Residents Lee Clark, Lived Experience Advisory Board The Lived Experience Advisory Board (LEAB) is a leadership development body consisting of members with current or past experience of homelessness. Members use this platform to learn about and evaluate the system of care and to make recommendations for improvement. Since the beginning of the pandemic, LEAB has been instrumental in helping meet the basic needs of our unsheltered neighbors. 19
Equitable Response and Recovery for Persons Experiencing Homelessness Gerry Thomas Boston Public Health Commission 20
The Scene in Boston Robust healthcare system Robust homeless service provider network Strong political will Mayor Walsh and now Mayor Janey Strong advocate community Historically low street homelessness /unsheltered Sheltered vs Unsheltered 2019 Unsheltered Transitional shelter beds Emergency shelter beds 0 500 1000 1500 2000 21
Bostons Situation 2020/2021 Usual practice of planning/managing for winter over-flow Feb 2020 COVID emerges High rates of infection, 31%-37% in April 2020 Need for improved infection control practices (PPE, social distancing) COVID- 19 Drugs Housing Racism as a public health and national crisis 22
Data was needed to answer: 1) number of additional beds needed due to weather 2) number of additional beds needed to meet social distancing/infection control standards 3) to determine types of new space needed quarantine, isolation, and respite 4) monitoring and controlling high rates of infections 5) progress on housing goals 6) progress on racial justice and health equity 23
Winter overflow and COVID specific beds Capacity planning Quarantine/Isolation/Respite Fall Demand (projected) 1250 Quarantine 22 beds initially Winter overflow demand (past 2 years) 191 Isolation/asymptomatic 60 beds Projected Winter need 1441 Respite/Isolation 500 bed hospital Current Safe Shelter Capacity (includes all sites) 1335 Gap to be filled 86 24
2021 Annual Homeless Census: Boston 2020 2021 % Change Individuals 25.9% -26.18% Program Type Single Adults Street Count Individuals 135 Individuals 170 Emergency Shelter 1,593 1,176 -36.69% Transitional Housing Subtotal: Single Adults 387 2,115 Persons in Families 245 1,591 Persons in Families -24.7% Persons in Families -26.59% Number of Families Number of Families Number of Families -30.40% Families Emergency Shelter 3,900 1,240 2,863 863 0% 0% Hotels/Motels 0 0 0 0 -24.79% -5.56% Transitional Housing 121 54 91 51 -26.54% Persons in Families 0.00% -29.37% Number of Families -58.33% Subtotal: Families 4,021 Persons in Families 1,294 Number of Families 2,954 Persons in Families 914 Number of Families Domestic Violence Emergency Shelter 56 24 56 10 NA NA Transitional Housing NA NA 44 12 78.57% -24.98% -8.33% 56 24 100 22 Subtotal: Domestic Violence 6,192 4,645 Total
What the data says about the current state of homelessness as a result of COVID. Numbers staying in shelter rapidly declined by 26%, 26% increase in street homelessness What guests told us: Fear of shelter risk of infection Inability to social distance Limited understanding of racial/ethnic (R/E) inequities in experience of homelessness and accessing housing 26
How was performance data impacted due to COVID - both positively and negatively? Quality and limited collection of R/E data highlighted Limited collection of information regarding unsheltered persons Redeployed front door triage quality of data and diversion also limited 27
How can the lessons learned from COVID alter how we do things in the future, including data? Data sharing agreements with health care and others Increase in flexibility and responsiveness Need redesign of shelter space move away from large overcrowded shelters Improved collection of R/E data New ways of collecting unsheltered numbers looking for help if anyone Summer census 28
Performance in the short term and how will it shape performance for the future? Monitor and control high rates of infections - continue Infection rates have declined to 0 2% Vaccination rates around 39% for guests and 61% for staff, goal is 70% or higher Prioritizing equity Ensuring equitable access to vaccines ESG-CV awards Housing focus continue and enhance 133 youth/young adult housed 698 individuals housed since beginning of the pandemic 149 placed with Barrier Buster fund 29
Demographic data: Vaccinated PEH As of 3/26/2021
Thank You 31
Montgomery County Coordinated Entry System: Using Data to Create Innovative Housing Interventions Amanda Harris, Chief of Services to End and Prevent Homelessness Ashley Richards, Data and Research Manager 32
SNAPSHOT OF MONTGOMERY COUNTY 2020 AMI: $126,000 2019 Average Gross Rent: $1793 2019 Poverty Rate: 7.4% Percent Severely Housing Burdened: 27% of renters Population: 1.1 Million
Services to End and Prevent Homelessness Acts as the Collaborative Applicant and HMIS Lead Oversees homeless crisis response system, permanent housing programs, and prevention Core Values Housing First and Person-Centered Diversity, Equity, and Inclusion Collaboration across the Continuum Data and Results Based Decisions Continuous Change and Improvement
Homelessness in Montgomery County Annual Point-in-Time Count (Individuals) Annual Point-in-Time Count (Families) 700 180 160 159 650 638 603598623616 140 600 600 126117 568 120 550 109 100 91 500 84 85 487480 80 450 441 61 60 60 400 40 29 350 20 300 0 2012 2013 2014 2015 2016 2017 2018 2019 2020 2021 2012 2013 2014 2015 2016 2017 2018 2019 2020 2021
Racial Disparities in the Homeless Continuum Distribution of Race Distribution of Ethnicity
Coordinated Entry System Moving beyond prioritization for Permanent Supportive Housing to create pathways to housing for everyone
CES for Single Individuals in Montgomery County Assessments include VI-SPDAT, full SPDAT, and Montgomery County Housing Supports Acuity Scale Prioritization in based on 10 Vulnerabilities Chronic Mental Health Chronic Substance Use Chronic Medical Conditions Chronic Cognitive Deficits Risk of Exploitation Poor Engagement with Services Poor Access to Mainstream Services Unsheltered Poor Management of ADLs Veteran Status Length of Time Homeless as tiebreaker
Distribution of Need Housing Intervention based on VI-SPDAT PSH 24% Self Resolve 28% Not yet Assessed 2% RRH 40% Outreach- No Assessment 6%
Prior Living Situation for Single Individuals Not Reported 13% Hospital 10% Jail 6% Shelter 5% Unsheltered 21% Family/ Friends 40% Permanent Housing 5%
Creative Housing Solutions Nontraditional housing interventions
Centralized Intake and Diversion Reduce inflow by resolving homelessness before entering the homeless continuum Diversion includes small grants to families to stabilize household Diversion training for other systems of care including hospitals, behavioral health, and jail
Exit Bonus Program Provides $5000 in direct cash assistance upon shelter exit Eligibility Criteria First time homelessness Homeless less than 6 months VI-SPDAT score of 6 or below Minimal or no mental health or substance issues Monthly surveys track client progress for 12 months to assess how the program has impacted clients To date, 26 people have participated with only one return to homelessness
COVID Rent Relief Program 6-month subsidy without services Housing location services offered Eligibility Criteria 6 or below on the VI-SDPAT or Full SPDAT equivalent Must have a lease Income below 50% AMI 99 people housed to date
Rental Assistance Program Permanent Shallow Subsidy 106 number of households on a fixed income Provides permanent shallow subsidy between $200 and $400 per month Eligibility Criteria Homeless or at imminent risk Over 55 or disabled Paying more than 50% of income toward rent Provides ongoing assistance for households exiting RRH, Exit Bonus, or COVID Rent Relief
Takeaways Importance of providing meaningful choices for people experiencing homelessness Using data to determine scale of need Effective use of resources not everyone needs/wants case management Taking risks
Questions? 48


