Impact of Economic Crisis on Youth Political Participation in Spain
The economic crisis in Spain has had profound repercussions on the political engagement of young people, leading to a shift in satisfaction with democracy, protest participation, and institutional involvement. The youth unemployment rate soared, influencing non-institutional forms of participation while also affecting electoral turnout. These changes reflect a complex interplay between economic challenges and political dynamics, shaping the landscape of youth politics in Spain.

Uploaded on Mar 02, 2025 | 0 Views
Download Presentation

Please find below an Image/Link to download the presentation.
The content on the website is provided AS IS for your information and personal use only. It may not be sold, licensed, or shared on other websites without obtaining consent from the author.If you encounter any issues during the download, it is possible that the publisher has removed the file from their server.
You are allowed to download the files provided on this website for personal or commercial use, subject to the condition that they are used lawfully. All files are the property of their respective owners.
The content on the website is provided AS IS for your information and personal use only. It may not be sold, licensed, or shared on other websites without obtaining consent from the author.
E N D
Presentation Transcript
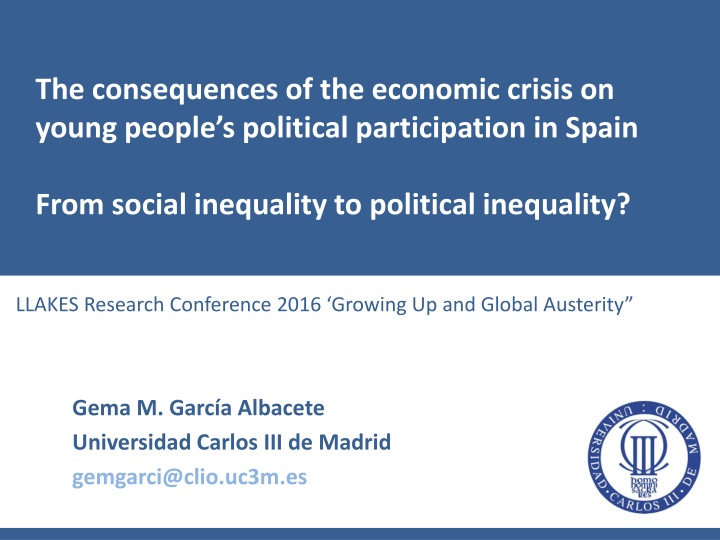
The consequences of the economic crisis on young people s political participation in Spain From social inequality to political inequality? LLAKES Research Conference 2016 Growing Up and Global Austerity Gema M. Garc a Albacete Universidad Carlos III de Madrid gemgarci@clio.uc3m.es
Great recession: dramatic economic consequences, particularly for young people Youth unemployment rate - % of active population aged 15-24 70 60 Denmark 50 Germany Ireland 40 Greece Spain 30 Netherlands Portugal Finland 20 United Kingdom 10 0 2007 2008 2009 2010 2011 2012 2013 2014 2015 Source: Eurostat, 2015
And political consequences: Satisfaction with democracy, average marginal effects, age and year, 2006 and 2012 Germany Spain Italy 7 7 7 6 6 6 5 5 5 4 4 4 3 3 3 18 to 25 26 to 35 36 to 45 46 to 55 56 to 65 Age 18 to 25 26 to 35 36 to 45 46 to 55 56 to 65 Age 18 to 25 26 to 35 36 to 45 46 to 55 56 to 65 Age 2006 2012
Non-institutional participation, average marginal effects, age and year Germany Spain Italy .5 .5 .5 .4 .4 .4 .3 .3 .3 .2 .2 .2 18 to 25 26 to 35 36 to 45 46 to 55 56 to 65 Age 18 to 25 26 to 35 36 to 45 46 to 55 56 to 65 Age 18 to 25 26 to 35 36 to 45 46 to 55 56 to 65 Age 2006 2012
Institutional participation (electoral turnout), average marginal effects, age and year Germany Spain Italy 1 1 1 .8 .8 .8 .6 .6 .6 .4 .4 .4 18 to 25 26 to 35 36 to 45 46 to 55 56 to 65 Age 18 to 25 26 to 35 36 to 45 46 to 55 56 to 65 Age 18 to 25 26 to 35 36 to 45 46 to 55 56 to 65 Age 2006 2012
Institutional unexpected change Consolidated and stable party system with two main parties Electoral system, proportional with strong majoritarian effects due to districts Key point: European Parliamentary Elections in May 2014 Podemos vote in 2014: young, no party id, low political trust (5 EMPs)
Party system change by age Vote recall General Elections 2015 by age group 66+ 46-65 31-45 18-30 0% 20% 40% 60% 80% 100% PP PSOE Podemos + Cs Others
From a democratic normative point of view it is all good - An interested and critical cohort of Young people willing to make their voice be heard - However, why are the 25-34 years more active than the 18-24? - Political socialization: We should expect social transformations to have a stronger effect on attitudes and behaviors among those in their formative years - Political crisis and mobilization larger participation - Economic crisis and social inequality distinct effects according to individual economic circumstances
Increase in social inequality Relative increase in percentage of people at risk of poverty or social exclusion by age (2014 2007) United Kingdom Spain Greece Euro area (17 countries) 0.0 2.0 4.0 6.0 8.0 10.0 12.0 14.0 16.0 18.0 20.0 25 to 49 years 16 to 24 years Total
Working hypothesis and expectations General argument: social inequality results in political inequality Expectations: - High levels of political involvement among young people who are still studying or already integrated into the labor market - Political apathy among young people in precarious circumstances
Model Data: 2015 December General Elections post electoral survey (realeased few weeks ago) DV: Types of participants: Non-institutional participation Yes No Institutional participation (Turnout) Yes Participants Voters No Protesters None Theoretical approach: How far are you willing to go? In addition, confirmation with IRT models Pure protesters? They do not seem to exist (these days)
Type of participants by age group (%) 18-24 25-34 35-44 45-54 55-64 None Turnout Participants 65+ 0 20 40 60 80 100 Percent
Model IV: - - Age, life cycle, young people (up to 30!) Education, as a proxy for resources, skills, cognitive abilities Previous studies contradictory findings regarding unemployment and political behavior - Unemployment vs other circumstances - Short vs long term unemployment - Uncertainty (low chances of finding a job if unemployed or high chances o losing it if employed) - Subjective social class - Control variables: gender (and education) Multinomial logistic regressions, one interaction IV * age group at a time
Participants by level of education and age 18-30 31-45 46-65 .8 .6 Predictions .4 .2 0 Primary Second Uni. Primary Second Uni Primary Second Uni None Voter Participants
Participants and unemployment by age 18-30 31-45 46-65 .8 .6 Predictions .4 .2 0 Other situations Unemployed Other Unemployed Other Unemployed None Voter Participants
Long vs short term unemployment 18-30 31-45 46-65 1 Predictions .5 0 Others Unemp Long U. Others Unemp Long U Others Unemp Long Unemp None Voter Participants
Uncertainty, low probs of finding a job or high probs of losing a job 18-30 31-45 46-65 .8 .6 Predictions .4 .2 0 No Yes No Yes No Yes Uncertainty None Voter Participants
Participation and perceived social class 18-30 31-45 1 .5 Predictions 0 46-65 66+ 1 .5 0 Low 2 3 4 5 6 7 8 9 High Low 2 3 4 5 6 7 8 9 High Subjective Social Class Scale (1-10) None Voter Participants
Preliminary conclusions It is about unemployment, long term unemployment Is it a new type of unemployment? Highly educated, apathy due to frustration? Social inequality results in political inequality, one of the most affected groups of the population is not getting involved politically in a context as politized and mobilized as the transition to democracy With potential long term consequences due to: - Impressionable years hypothesis - Participation as a matter of habit Work in progress: Longitudinal perspectives with previous elections Mechanisms: political efficacy, trust in institutions
Institutional participation 0.2 Marginal effect of being young 0.1 0 -0.1 1 2 3 4 Interest in politics Non-institutional participation 0.2 Marginal effect of being young 0.1 0 -0.1 1 2 3 4 Interest in politics


")

, average")


")