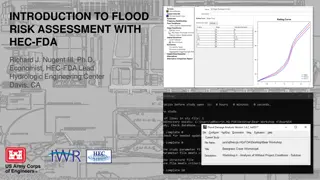
Explore the significance of economic multipliers in the assessment of public sector projects, focusing on indicators like GDP, employment, and household income to measure economic growth and poverty alleviation contributions.
Please find below an Image/Link to download the presentation.
The content on the website is provided AS IS for your information and personal use only. It may not be sold, licensed, or shared on other websites without obtaining consent from the author. If you encounter any issues during the download, it is possible that the publisher has removed the file from their server.
You are allowed to download the files provided on this website for personal or commercial use, subject to the condition that they are used lawfully. All files are the property of their respective owners.
The content on the website is provided AS IS for your information and personal use only. It may not be sold, licensed, or shared on other websites without obtaining consent from the author.
E N D
Presentation Transcript
MVOTI TO UMZIMKULU CLASSIFICATION STUDY DWA CORPORATE IDENTITY Presented by: Johan Maree Deputy Director: Media Production 26 November 2014 Item:8.4 SOCIO ECONOMIC CONSEQUENCES WATER OUT OF THE RIVER William Mullins PSC Meeting 12 December 2012
Socio Economic evaluation in the public sector Attributes Public Sector Private Sector Perspective The broader community Project shareholders/Capital providers Goal Most effective application of scarce resources Maximization of net value Scope All aspects necessary for a rational economic decision Limited to aspect that affect profits Benefits Additional goods, services, income and cost saving Profit and financial return on capital employed Costs Opportunity costs of goods and services foregone Financial payments and depreciation calculate according to generally accepted accounting principles 2
Why use the selected metrics We use the indicators to: Show Economic growth Indicate Poverty alleviation contribution GDP: Value added made up of three elements: I. Remuneration of employees (payments to households) II. Gross operating surplus (profit and depreciation) III. Net indirect taxes Employment: This metric indicates the number of additional jobs as a result of a change in water provision. Employment is used to indicate poverty alleviation. 3
Some explanation Gross Domestic Product (GPD): Used to measure the economic output of a region as well as relative contribution of an industrial sector. Growth size is dependent on the multiplier effect. Payment to households: One of the elements of the value added (i.e. GDP) which results from the sector where water is allocated is the remuneration of employees, which, in turn, affects household income. Multipliers: The fiscal multiplier effect occurs when an initial injection into the economy causes a bigger final increase in national income 4
Effect of multipliers In the economy, there is a circular flow of income and spending. Money that is earned flows from one source to another, and most of it gets spent again, multiple times. What this means is that small increases in spending lead to much larger increases in economic output. Multipliers are then used to measure how much spending gets multiplied. To illustrate this, let's take a look at a very simple economy: 5
Principle behind multipliers Consider a R300 million increase in capital investment, for example, if Toyota invests in a new assembly plant. This will set of a chain of increases and expenditures. Businesses who win contracts to build the new factory will see an increase in income and profits If they and their employees in turn collectively spend about of that additional income, then R150 million will be added to the income of others. At this point, total income has grown by R300m + R150m The sum will continue to increase as producers of additional goods and services realize an increase in their incomes, of which they in turn spend on even more goods and services. This is what is meant by the multiplier effect 6
How multipliers are applied on value of status quo If the water to the sector is reduced by 6 million m3 The GDP is reduced by (6x4) = R24 million. Employment = number/million m3 i.e. 350 per Mm3 Employment is reduced by (6x 350) = 2 150 jobs. The same applied for household income. Just keep in mind that if the volume of available water increase, it does not necessarily lead to an increase of economic activity! 7
Compounded Growth The total additional water volume is taken up over time . Look at the difference of1% over a very long period make. As it is always very difficult to do a forecast into the future using the current historical available data as a base, the above figures must be treated with caution. It is good practice to update the different growth values every 5 to 10 years. Year Growth Rate 1 2 3 10 20 30 40 Population 1.08% 1.08% 2.17% 3.28% 11.34% 23.97% 38.02% 53.68% Water 1.436% 1.436% 2.89% 4.37% 15.32% 33.00% 53.38% 76.88% 5% 5.0% 10.25% 15.76% 62.89% 165.33% 332.19% 604.00% Economy 4% 4.0% 8.16% 12.49% 48.02% 119.11% 224.34% 380.10%
Discounting Discounting what is it and why do it? Discounting is the reverse of adding (or compounding) interest. It reduces the monetary value of future costs and benefits back to a common time dimension the base year/date. Discounting satisfies the view that people prefer immediate benefits over future benefits (social time preference) and it also enables the opportunity cost to be reflected (opportunity cost of capital). 9
Methodology based on CBA principles Status quo Volume of water Status quo Value of water in GDP i.e. R4/m3 Growth on status quo 1.436% on water baseline demand Status quo Employment i.e. 1000employees/Mm3 Apply value of water on growth volume Multiply volume with R4/m3 Discount according to CBA principles Apply employment on growth volume Multiply volume with 1000employees/Mm3 Projected GDP growth Projected additional employment 10
Economic sectors used in evaluation Irrigation Industry Wet industry Dry industry Commercial business sector Urban domestic water consumption Water related services Ex. Municipal parks & recreation Informal businesses Plumbing 11
Informal sector The informal sector has the following two components: 1) Employees working in establishments that employ less than five employees, who do not deduct income tax from their salaries/wages; and 2) Employers, own-account workers and persons helping unpaid Source: StatsSA KwaZulu-Natal has 19% (459 000) of the workforce which operates in the informal economy. This number excludes agriculture and domestic workers. - Labour Force Survey October 2014 Statistics SA 12
Water volumes ( Mm3/a) Mvoti Isithundu Excess Firm Yield MV3 34.88 MV41 8.08 MV42 15.22 MV43 13.77 Umkhomazi Scenarios Smithfield HFY (No support to Ngwadini) Ngwadini HFY (No sup from Smithfield) No EWR With EWR No EWR With EWR MK1 MK2 196.0 11.99 MK21 142.20 8.03 MK22 150.60 8.03 MK23 150.60 8.03 MK31 150.10 5.98 MK32 161.00 6.63 MK33 161.00 6.63 Smithfield HFY (With support to Ngwadini) Ngwadini HFY (With support from Smithfield) Mkomazi multiplier MK4 142.5 54.80 MK41 84.10 54.80 MK42 92.50 54.80 13
Costs and benefits in Mvoti 1. Benefits: 1. Additional water allocated to the following sectors: 1. Industrial 2. Urban domestic 3. Irrigation 2. Costs 1. Construction costs - dam 2. Maintenance costs 3. Operational costs 14
Costs and benefits in Mkomazi 1. Benefits: 1. Additional water allocated to the following sectors: 1. Industrial 2. Urban domestic 3. Saiccor 2. Costs 1. Construction costs 1. Ngwadini construction 2. Smithfield construction 2. Maintenance costs 3. Operational costs 17


")