Impact of Fitness Mutations on Clonal Evolution
Explore the dynamics of clonal evolution and the effects of fitness mutations on population growth. Discover how hitchhiking mutations and prevalence play a role in shaping evolutionary trajectories. Learn about estimating growth rates from mutational frequencies and optimizing based on hitchhiking VAFs.

Download Presentation

Please find below an Image/Link to download the presentation.
The content on the website is provided AS IS for your information and personal use only. It may not be sold, licensed, or shared on other websites without obtaining consent from the author. If you encounter any issues during the download, it is possible that the publisher has removed the file from their server.
You are allowed to download the files provided on this website for personal or commercial use, subject to the condition that they are used lawfully. All files are the property of their respective owners.
The content on the website is provided AS IS for your information and personal use only. It may not be sold, licensed, or shared on other websites without obtaining consent from the author.
E N D
Presentation Transcript
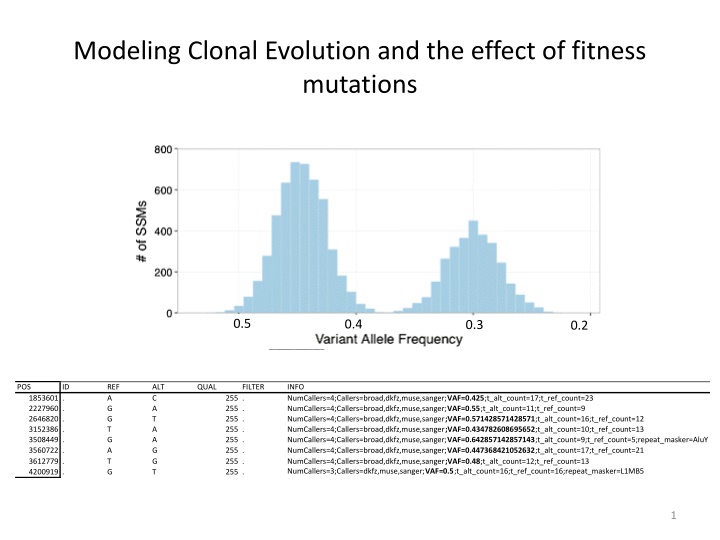
Modeling Clonal Evolution and the effect of fitness mutations 0.5 0.4 0.3 0.2 POS ID REF A G G T G A T G ALT C A T A A G G T QUAL FILTER INFO NumCallers=4;Callers=broad,dkfz,muse,sanger;VAF=0.425;t_alt_count=17;t_ref_count=23 NumCallers=4;Callers=broad,dkfz,muse,sanger;VAF=0.55;t_alt_count=11;t_ref_count=9 NumCallers=4;Callers=broad,dkfz,muse,sanger;VAF=0.571428571428571;t_alt_count=16;t_ref_count=12 NumCallers=4;Callers=broad,dkfz,muse,sanger;VAF=0.434782608695652;t_alt_count=10;t_ref_count=13 NumCallers=4;Callers=broad,dkfz,muse,sanger;VAF=0.642857142857143;t_alt_count=9;t_ref_count=5;repeat_masker=AluY NumCallers=4;Callers=broad,dkfz,muse,sanger;VAF=0.447368421052632;t_alt_count=17;t_ref_count=21 NumCallers=4;Callers=broad,dkfz,muse,sanger;VAF=0.48;t_alt_count=12;t_ref_count=13 NumCallers=3;Callers=dkfz,muse,sanger;VAF=0.5;t_alt_count=16;t_ref_count=16;repeat_masker=L1MB5 1853601 . 2227960 . 2646820 . 3152386 . 3508449 . 3560722 . 3612779 . 4200919 . 255 . 255 . 255 . 255 . 255 . 255 . 255 . 255 . 1
Hitchhiking prevalence No fitness mutation fitness mutation 0 1 2 3 4 0 1 2 3 4 8/16 = 0.5 12/20 = 0.6 8/20 = 0.4 4/16 = 0.25 8/16 = 0.5 8/20 = 0.4
Modeling growth fitness mutation By considering a steady mutation rate, the population is growing according to In this situation, at any time point of sample observation T, the mutational frequency of a mutation that happened in time tm would be equal to m Now, let s assume that at time t1, a mutation occurs that increases the growth rate of the specific subpopulation by k, in a way that the new population is now expanding as 0 1 2 3 4 t1 t2
Hitchhiking prevalence fitness mutation Mutations that occurred on the blue lineage while t < t1 (before fitness mutation), will also have a higher frequency since they are present in every k-fit cell by definition 0 1 2 3 4 t1 t2
Hitchhiking prevalence fitness mutation In these terms, at total time T=t1+t2 0 1 2 3 4 t2
Hitchhiking prevalence Optimizing based on hitchhiking VAFs, each one satisfying Which is in the form of 0 1 2 3 4 Allowing to estimate growth rate r from hitchhiking mutations t1 t2
Hitchhiking prevalence fitness mutation Early Hitchhiked Mutations with growth r Fit population with growth K*r -log(r) 4.5 4 3.5 3 2.5 2 1.5 1 fitness mutation 0.5 0 116 139 162 185 208 231 254 277 300 323 346 369 392 415 438 461 484 507 530 553 1 24 47 70 93 For Simulations - Foreach (prevalent mutation) - Estimate r from window of (5-6 or 7) hitchhike mutations - Estimate the effect K (compared to real K) - Identify peaks, drivers For PCAWG data Foreach (clonal mutation) - Optimize growth r using a window of (~100?) hitchhiking mutations and fit Non-Linear Least Square Reg. - Identify peaks, estimate effect K - Re-optimize for population size, clonal size 0 1 2 3 4 t1 t2 7
Individual Tumor growth model and future directions Predict changes in Individual tumor growth rate r Select peaks/effect size Suggest the presence of a driver (?missing drivers?) Identify driver candidates (improved with depth) Compare the effect between different mutations/genes/genetypes/tumors (For example PTEN vs RAS; Prostate vs Lung; TSG vs Immune Response genes) Use for power calculations (define the effect and sequencing needed) Compare our findings with Paper E Model Liabilities: Sequencing depth Subclone assignment Model fit optimization Use of more complex models Future directions Compare different growth models based on ML Under model and growth parameters, optimize for population size and fluctuations Associate clonal evolution with Immune antibody repertoire evolution (Kleinstein) 11
Individual Tumor growth model and future directions Predict changes in Individual tumor growth rate r Select peaks/effect size Suggest the presence of a driver (?missing drivers?) Identify driver candidates (improved with depth) Compare the effect between different mutations/genes/genetypes/tumors (For example PTEN vs RAS; Prostate vs Lung; TSG vs Immune Response genes) Use for power calculations (define the effect and sequencing needed) Compare our findings with Paper E Model Liabilities: Sequencing depth Subclone assignment Model fit optimization Use of more complex models Future directions Compare different growth models based on ML Under model and growth parameters, optimize for population size and fluctuations Associate clonal evolution with Immune antibody repertoire evolution (Kleinstein) 12
300x Amyloid tumor genome 7 6 5 4 3 -lot (growth rate) 2 + for missence, - for intronic 1 0 115 229 343 457 571 685 799 913 1027 1141 1255 1369 1483 1597 1711 1825 1939 2053 2167 2281 2395 2509 2623 2737 2851 2965 3079 3193 3307 3421 3535 3649 3763 1 -1 -2 -3
300x Amyloid tumor genome 16 14 12 10 8 -log growth rate K effect 6 +> for missense ->intronic 4 2 0 115 229 343 457 571 685 799 913 1027 1141 1255 1369 1483 1597 1711 1825 1939 2053 2167 2281 2395 2509 2623 2737 2851 2965 3079 3193 3307 3421 3535 3649 3763 1 -2 -4


