Impact of Hospital Closures on Ambulance Transport Time
This project explores the effects of hospital closures on patient time in ambulances, potentially leading to worse health outcomes. With data from 2010-2015, it analyzes rural and urban closures, characteristics of hospitals, and ambulance service history.

Download Presentation

Please find below an Image/Link to download the presentation.
The content on the website is provided AS IS for your information and personal use only. It may not be sold, licensed, or shared on other websites without obtaining consent from the author.If you encounter any issues during the download, it is possible that the publisher has removed the file from their server.
You are allowed to download the files provided on this website for personal or commercial use, subject to the condition that they are used lawfully. All files are the property of their respective owners.
The content on the website is provided AS IS for your information and personal use only. It may not be sold, licensed, or shared on other websites without obtaining consent from the author.
E N D
Presentation Transcript
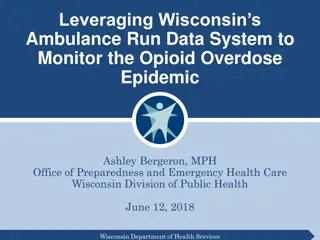
This project was supported by the Federal Office of Rural Health Policy (FORHP), Health Resources and Services Administration (HRSA), U.S. Department of Health and Human Services (HHS) under cooperative agreement # U1CRH30041. Hospital Closure: Does It Affect Patient Time in an Ambulance? SuZanne Troske, MS; Alison Davis, PhD May 3, 2018
Research Question When a hospital closes in a community do patients spend more time in an ambulance being transported to an emergency department (ED)? Why is this important? Additional time in an ambulance could lead to worse health outcomes.
Hospital Closure A hospital closure is defined as a facility that stopped providing general, short-term acute inpatient care. (Center for Medicaid and Medicare definition) Since 2010, 120 hospitals closed, half in rural areas. In most cases, ED services also closed.
Hospital Data List of urban and rural hospital closures from several sources including the University of North Carolina SHEP Center and Health Resources and Services Administration (HRSA). Hospital Compare data for list of all Medicare- approved hospitals in U.S. by location by year. All data are from 2010-2015. Hospital closures are for 2011-2014.
Hospital Closures 2011-2014 Map of closed hospitals, rural and urban Red = Rural Blue = Urban Missing one closure in HI
Characteristics of Hospitals Years 2011-2014 Number of hospitals Urban (percent) Rural (percent) Mean number of beds Small hospital - 1st tertile Medium hospital - 2nd tertile Large hospital - 3rd tertile Census Division (percent by column) 1 New England 2 PA Middle Atlantic 3 East North Central 4 West North Central 5 SC South Atlantic 6 KY East South Central 7 TX West South Central 8 Mountain 9 Pacific Closed 91 52.2 47.8 108.3 20.6 51.3 229.1 Closed rural 43 - - 38.2 22.3 49.8 102.0 Open 4,702 59.1 41.0 193.3 26.4 116.1 441.1 3.3 11.0 12.1 4.4 12.1 14.3 29.7 4.4 8.8 4.9 1.6 8.2 9.8 16.4 23.0 27.9 4.9 3.3 4.1 9.0 15.7 14.0 14.7 8.4 14.7 8.3 11.2
Ambulance Service History Modern EMS started in the 1960s. Prior to 1960s in most communities, patients were driven to hospital by family, friends or the local funeral home. Increased car travel lead to increased car crashes and injured motorists needing transport to hospitals. In 1966, the National Highway Safety Act required states to develop systems to rescue injured motorists.
Ambulance Service History Ambulance services are no longer Federally mandated. Some credit the 1970s TV show, Emergency, with promoting ambulance services across U.S.
Ambulance Service Today In the 2011 NASEMSO (National Association of State EMS Officials) survey, the number of credentialed EMS agencies in the U.S. was 19,437. In 2009, there were an estimated 36 million EMS event responses with 28 million transports.
Ambulance Data Ambulance data from the National Emergency Medical Services Information System (NEMSIS). De-identified individual patient and incident statistics on a single ambulance use. Transport Time: time from scene to ED Characteristics: Managed by Fire Departments, Private Companies, Hospitals, Government agencies, Community Non-Profits Ambulance personnel most often paid EMT Paramedics Primary level of service: Advanced Life Support, Basic Life Support Urbanicity and Census division of incident zip code
Ambulance Data NEMSIS is a convenience sample meaning the data are voluntarily collected from states. In 2015, 47 states reported data. DE, MA, OH and TX do not report. Eligible closures = 46
Characteristics of Hospitals Years 2011-2014 Number of hospitals Urban (percent) Rural (percent) Mean number of beds Small hospital - 1st tertile Medium hospital - 2nd tertile Large hospital - 3rd tertile Census Division (percent by column) 1 New England 2 PA Middle Atlantic 3 East North Central 4 West North Central 5 SC South Atlantic 6 KY East South Central 7 TX West South Central 8 Mountain 9 Pacific Closed 91 52.2 47.8 108.3 20.6 51.3 229.1 Closed rural 43 - - 38.2 22.3 49.8 102.0 Eligible closures 46 43.5 56.5 96.2 20.9 54.5 233.5 3.3 11.0 12.1 4.4 12.1 14.3 29.7 4.4 8.8 4.9 1.6 8.2 9.8 16.4 23.0 27.9 4.9 3.3 2.2 19.6 6.5 8.7 17.4 28.3 4.4 6.5 6.5
Medicare Patients Who are we studying? Medicare-aged patients over 65 years old 9-1-1 emergency calls and transported to an ED Why this population? In 2013, 11% of Medicare beneficiaries used ambulance services in past year. (5.8 million beneficiaries). Most over 65 are covered by Medicare insurance which is similar across the U.S. Medicare requires patients to be transported to the closest hospital. Most incidents happen at home as opposed to at work.
Medicare Patients Closed hospitals affect poor, elderly and minorities the most. (Kaufman et al. 2016) Medicare patients use ED proportionally more in rural areas over urban areas. (Hall et al. 2010) Medicare Payment Advisory Commission (MEDPAC) recognized reduced demand for inpatient care, but stated there was still a need for emergency care for Medicare beneficiaries especially in rural communities. (MEDPAC 2017)
Other Research Is there a change in distance or time in an ambulance when hospital closes? Rural residents average 13 miles farther away from ED when hospital closed. (Kaufman et al. 2016) In California, 8.6% of patients had increased distance to ED (0.1 to 33.4 miles). (Hsia et al. 2012) Few studies looking at increased time in an ambulance.
Other Research What are the effects on health outcomes of increased distance or time to an ED? In LA County, study found increased deaths due to heart attacks and injuries when increased travel distance to hospital. (Buchmueller et al. 2006) In cities on the days of marathons, heart attack patients spent 32% longer time in an ambulance and increased their 5-week mortality rate from 24% to 28%. (Jena et al. 2017)
Other Research Do patients change behavior when a hospital closes? Increased distance due to hospital closure lead to a 4% shift in care to a physician s office. (Buchmueller et al. 2006) If an ED closed in New York, a study found volume in neighboring EDs increased by 0.8% on average as opposed to the predicted 1.0% increase. (Lee et al. 2015)
Difference-in-Difference Model Difference-in-difference (DD) estimator: 1=(TCy2,hospclose-TTy2,hospnoclose) (TCy1,hospnoclose-TTy1,hospnoclose) Year before closure Year after closure Zip with No Hospital closure Zip where Hospital closed Level of analysis is zip code TT=Transport time no hospital closure in zip code TC=Transport time with hospital closure in zip code Y1 = Prior year, Y2 = Post year Hospclose = Hospital closed by Y2 Hospnoclose = No hospitals closed in Y1 or Y2 TT (y1, hospnoclose) TT (y2, hospnoclose) TC (y1, hospnoclose) TC (y2, hospclose)
Methodology Dilemma Hospital data cannot be linked to ambulance data and transport time outcome variable. Cannot use outcome variable to test if there are other factors affecting call times during period of closure. Using hospital data, we construct treated and comparison groups of zip codes which look similar using propensity score match. The zip codes are matched to the ambulance data and we run the DD controlling for ambulance call characteristics.
Treated Group Treated group are zip codes with hospital closures. Deleted zip codes with no population. Deleted zip codes where NEMSIS does not collect ambulance data: TX, OH, MA, DE. Use closures from 2011-2014 to allow DD analysis. Final count of hospital closures = 46
Comparison Group Selected zip codes without hospital closures from summary of Hospital Compare data. Deleted zip codes with no population. Deleted zip codes where NEMSIS does not collect ambulance data: TX, OH, MA, DE.
Final Match Used propensity score matching to construct comparison group. Many-to-one matching based on the propensity score calculated from logit regression. Used radius match on the specified difference between log-odds of the propensity score. Year by year match Control variables are zip code characteristics such as population density, median income, and median age.
Final Match Why many-to-one match? Does not limit number of matches in each year. Produces more precise estimates of the effect of hospital closures. (Mueser et al. 2007) Lost 3 hospital closures because of no match. Ran a balance test to compare t-tests on control variables between treated and comparison groups.
Final Match Final file sent to NEMSIS to be matched 46 treated zip codes 7,615 comparison zip codes NEMSIS will return a de-identified file with all transport call times pre and post-year of closure for treated and comparison group zip codes. Results are coming soon.