Impact of Media Mix and Ad Creativity on Profit Growth
Explore insights on the growth of ad-supported quality content viewing habits, the influence of relaxation on ad noticeability, the importance of creative consistency for brands, optimal ad mix by product sector, and the significant role of Linear TV in ad-generated profits.

Download Presentation

Please find below an Image/Link to download the presentation.
The content on the website is provided AS IS for your information and personal use only. It may not be sold, licensed, or shared on other websites without obtaining consent from the author. If you encounter any issues during the download, it is possible that the publisher has removed the file from their server.
You are allowed to download the files provided on this website for personal or commercial use, subject to the condition that they are used lawfully. All files are the property of their respective owners.
The content on the website is provided AS IS for your information and personal use only. It may not be sold, licensed, or shared on other websites without obtaining consent from the author.
E N D
Presentation Transcript
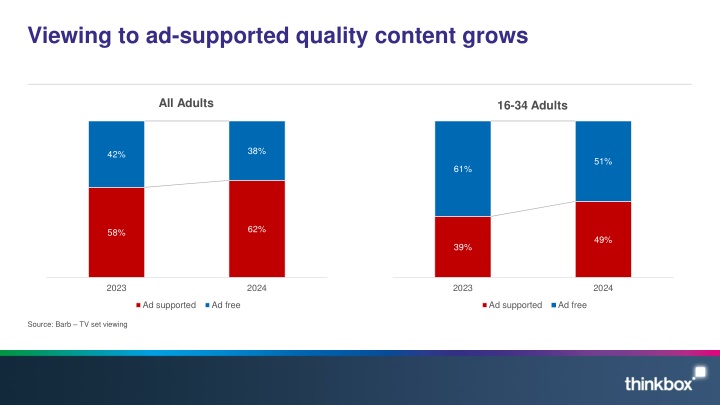
Viewing to ad-supported quality content grows All Adults 16-34 Adults 38% 42% 51% 61% 62% 58% 49% 39% 2023 2024 2023 2024 Ad supported Ad free Ad supported Ad free Source: Barb TV set viewing
Ads are more noticed when people are relaxed and/or in a good mood Source: Bronner (2007), reported by Richard Shotton (The Value of TV: A Behavioural Science Perspective, 2024)
Creatively consistent brands report more very large business effects Source: System 1 / IPA, The Magic of Compound Creativity, 56 brands across 44 categories analysed between 2018 and 2024 for 13 different Creative Consistency Features, split into thirds. comparing the most to the least consistent brands. 4,164 TV ads with 3.3bil media spend. Matched with IPA awards cases.
Optimal ad mix varies dramatically by product sector Optimal media mix 100% 4% 4% 2% 2% 2% 4% 10% 3% 2% 5% 5% 7% 90% 8% 3% 9% 8% 6% Share of Media Spend, % 8% 5% 7% 3% 80% 7% 8% 12% 17% 25% 7% 18% 70% 12% 21% 2% 5% 5% 14% 60% 9% 5% 16% 8% 50% 40% 30% 60% 59% 57% 56% 55% 48% 45% 20% 10% 0% All Automotive Finance FMCG Retail Travel Telecoms Linear TV BVOD Generic PPC Online Video Print Cinema Audio Paid Social Online Display Out of Home Source: Media Mix Navigator, 2024. Based on a mass market brand, 11-20% online sales (finance 71-80%), high risk, further details for each category is included in the notes
Linear TV creates nearly half of all ad-generated profit Linear TV Generic PPC Paid Social BVOD Audio Print Online video OOH Online Display Cinema 0% 5% 10% 15% 20% 25% 30% 35% 40% 45% 50% % of full profit volume Immediate Carryover Sustained Source: Profit Ability 2, April 2024 Short term benchmarks: Ebiquity, EssenceMediacom, Gain Theory, Mindshare, Wavemaker UK. Long Term Multipliers: EssenceMediacom, Gain Theory, Mindshare, Wavemaker UK. Immediate contribution = same week as advertising, Carryover = within 13 weeks, Sustained = within 2 years
TV has the highest weekly saturation point Saturation based on immediate payback all category average Linear TV 330,000 Print 123,000 Audio 92,000 Cinema 58,000 OOH 56,000 BVOD 54,000 Generic PPC 47,000 Online Video 40,000 Online Display 31,000 Paid Social 31,000 0 50,000 100,000 150,000 200,000 250,000 300,000 350,000 Saturation Point - Weekly - Based on Immediate Payback only Saturation point based on all category average. Saturation ranking & values will vary sector to sector Source: Profit Ability 2, April 2024 Short term benchmarks: Ebiquity, EssenceMediacom, Gain Theory, Mindshare, Wavemaker UK. Immediate effect = profit volume in week of advertising spend
TV (Linear and BVOD) accounts for over half of all ad-driven profit Source: Profit Ability 2, April 2024 Short term benchmarks: Ebiquity, EssenceMediacom, Gain Theory, Mindshare, Wavemaker UK. Long Term Multipliers: EssenceMediacom, Gain Theory, Mindshare, Wavemaker UK
The TV screen drives the highest ad recall of all devices Source: Context Effects, Map the Territory & Tapestry Research, 2024
TV is a trusted medium Source: IPA Databank 2014-2022 for profit cases *data available from 2016


 accounts for over half of all ad-driven")