Explore the impact of oil exploitation on wellbeing in Chad through the assessment of oil revenues at a local level. Discover the challenges and potential solutions in managing oil rents to reduce poverty and inequality. Utilizing data from household surveys and governmental frameworks, this study delves into the multidimensional effects of oil revenues on economic wellbeing in Chad.
Please find below an Image/Link to download the presentation.
The content on the website is provided AS IS for your information and personal use only. It may not be sold, licensed, or shared on other websites without obtaining consent from the author. If you encounter any issues during the download, it is possible that the publisher has removed the file from their server.
You are allowed to download the files provided on this website for personal or commercial use, subject to the condition that they are used lawfully. All files are the property of their respective owners.
The content on the website is provided AS IS for your information and personal use only. It may not be sold, licensed, or shared on other websites without obtaining consent from the author.
E N D
Presentation Transcript
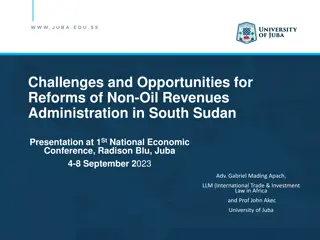
The impact of oil exploitation on wellbeing in Chad Gadom Djal Gadom Mboutchouang Kountchou Armand Abdelkrim Araar African Economic Conference 2017 Governance for Structural Transformation 4-6 December 2017, Addis Ababa, Ethiopia
Contents Introduction Research question and objective Data and methodology Results Conclusion
Introduction Oil exploitation is crucial for the chadian economic performance 88% of exports since 2004 over 30% of GDP 75% of ordinary budget revenues But in contrast: The country ranks 184th over 187 countries in 2013 according to its HDI 46.7% of Chadians live in extreme income poverty in 2011 The depth of poverty is around 19.7% and, the gap between the rich and the poor has widened Important local disparities (among departments or counties)
Introduction (contd) The issue of local resource curse Country s capacity to better manage and redistribute oil revenues across localities in order to reduce both poverty and inequality (economic wellbeing) A better redistribution of oil revenues as a solution to face the local resource course issue The Law 001/PR/1999 constituted the legal framework for the management of oil rent taking into account future generation and priority sectors The government has set up the National Poverty Reduction Papers and established the National Development Plan (PND) to support the oil revenues management law in order to better reduce the poverty. The oil revenues allocated to the priority sectors have been invested for the building of different types of infrastructure in the different departments.
Section title Research question and objective Question What is the local impact of oil revenues on multidimensional wellbeing in Chad Objective Assess the impact of oil revenues on multidimensional wellbeing at local (county) level in Chad
Section title Data The two last Chad Household Consumption and Informal Sector surveys (ECOSIT 2 & 3) conducted in 2003 and 2011 respectively by INSEED (National Institute of Statistics and Demographic Studies) these household surveys provide unique data sources to conduct analyses of non-monetary wellbeing in Chad their stratified sampling design also helps to cover all of the departments within the country Samples: 6,695 households in 2003 and 9,259 in 2011 Offer intervention (2011) analysis framework an interesting pre-intervention (2003) and post- The CCSRP organ provides data on the amounts of oil revenue allocated between departments since 2005 62 counties/departments after harmonization
Section title Methodology (Cont d) 1. A synthetic MDW index is first estimated using a MCA based on a welfare Main text indicators (housing, education, health and durable goods) 2. The impact evaluation analysis framework : It is acknowledged that to better alleviate the resource curse and achieve development goals, natural resource governance requires redistribution mechanisms to be set up according to the development needs in different localities Assuming that development needs are highly correlated to the size of the population in each geographic unit (department), it is possible to consider a ratio for each department that indicates whether the redistribution policy has been favorable or not to its demographic needs ??? ???????? ???????????????? ??? ???????? ?????????????? ???????????????????? ?????????????????? ???? ???? ??= = dr 1 Departments (counties) treated
Section title Methodology (Cont d) Main text DID estimation approach within a linear regression framework ???= ? + ?.? + ?.??+ ?. ?.?? + ?.???+ ??? Assuming that the probability to be treated is independent from any observable characteristics of the recipient departments out of their respective demographic weights, the causal effect at the county level is given by (1) (0) d d Y Y Variables N 124 124 124 124 124 124 124 124 Mean 0.6799 0.5 0.8390 0.2419 49.309 9929.4 441.17 257143 S.D. 0.5005 0.5020 1.5270 0.4299 86.942 40487.8 251.033 286739 Min. 0.2682 0 0.2410 0 0.0206 0.0004 0 0 Max. 3.2439 1 8.9378 1 620.07 384496 1080.79 1168119 MDW (average scores of multidimensional wellbeing index) Time (0 = year 2003 ; 1 = year 2011) Ratio (computed ??ratio) Treatment (1 = treated ; 0 = untreated) Density of population (habitants of department d / km2) Squared density of population Distance from department d to N Djamena (km2) Squared distance to N Djamena
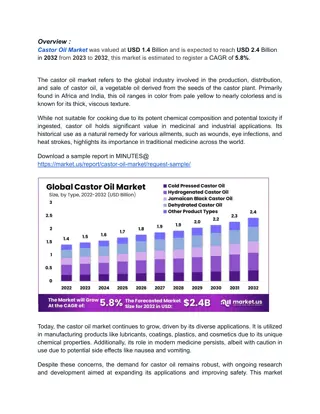
Results Some stylized facts on wellbeing and oil revenues redistribution in Chad Evoluation of Multidimensional Well-being The distribution of oil revenue across departments The change in average departmental scores bertween 2003 and 2011 Change between 1.00 and 1.25 Change between 0.70 and 1.00 Change between 0.50 and 0.75 Change between 0.25 and 0.50 Change between 0.00 and 0.25 Change between -0.25 and 0.00 Change between -0.50 and -0.25 Change between -2.50 and -0.50 The ratio of oil revenue (Tchad 2009) (.8832,6.492281] (.469,.8832] (.1302465,.469] [.0244,.1302465] Tibesti Tibesti Ennedi Ouest Borkou Ennedi Ouest Borkou Ennedi Est Ennedi Est Nokou Kob Nokou Kob Biltine Biltine Fitri Barh El Gaze Dar Tama Fitri Barh El Gaze Dar Tama Kanem Batha Est Kanem Mamdi Ouara Batha Est Assoungha Mamdi Ouara Wayi Assoungha Wayi Batha Oues Dagana Batha Oues Dagana Haraze Al Bi Djourf Al Ah Mangalm Dababa Haraze Al Bi Djourf Al Ah Mangalm Dababa Barh Signaka Bitkine Sila Barh Signaka Bitkine Sila N'Djamena N'Djamena Baguirmi Aboude a Baguirmi Aboude a Barh Azoum Gu ra Barh Azoum Gu ra Loug Chari Mayo-Boneye Haraze Mangu Loug Chari Mayo-Boneye Haraze Mangu Mont Illi Lac L r Mont Illi Tandjil Est Lac Iro Barh K h Kabbia Tandjil Oue Lac L r Tandjil Est Lac Iro Barh K h Kabbia Tandjil Oue B r Mandoul Orie Mayo-Dallah B r Mandoul Orie Ngourkosso Mayo-Dallah Ngourkosso Lac Wey Dodj Mandoul Occi Lac Wey Lanya Pend Barh Sara Dodj Mandoul Occi Grande Sido Lanya Pend Barh Sara Grande Sido Nya Pend Monts de Lam Nya Pend Monts de Lam
Results (Contd) Discontinuous impacts of intense oil revenues on multidimensional wellbeing
Results (Contd) Sensitivity analyses and robustness checks ???= ? + ?.? + ?. ?.?? + ?.???+ ??? Variables Without Departmental covariates F.E. With Departmental covariates F.E. R.E. R.E. Basic DID dummy variables Time .138026* (.080996) .081546* (.045735) .159879 (.099764) .098846** (.049520) .137901 (.112777) .078836 (.047643) .054890 (.095015) .062755* (.035961) Time Ratio Department characteristics Density of population - .000595 (.001574) .000001 (.000002) .001658 (.001325) - .0000007 (.000002) - .001683 (.001266) .000001* (.000001) .902900*** (.303806) 124 .029 .269 .184 Squared density of population Distance to N Djamena Squared distance to N Djamena .662438*** (.036843) 124 .044 .055 .049 .662438*** (.072588) 124 .044 .055 .049 .673577*** (.047881) 124 .049 .060 .053 Constant Observations (N) Within R-squared (R2) Between R-squared (R2) Overall R-squared (R2) Heteroskedasticity (p-value) Auxiliary test (p-value) .000 .563 .000 .431
Results (Contd) Sensitivity analyses and robustness checks Local impacts of intense oil revenues with the QR and the PWR models .4 Quantile Regression Percentile Weights Regression .3 .2 .1 0 0 .2 .4 .6 .8 1 Percentiles: based on estimated scores
Section title Conclusion Our contribution Contibute to the empirical literature on the potential local effects of oil revenues redistribution policy on MDW in Africa, and specifically in Chad. Propose an original framework analysis helping to assess the local impact of oil revenues redistribution policy on welfare indicators such as MDW. Provide policy evidence on the extent of the local resource curse in Chad
Section title Conclusion (Cont d) Main results There is a significant positive link between oil revenu transfers and MDW Departments receiving intense oil transfers increased their MDW about 35% more than those disadvantaged by the oil revenues redistribution policy The farther a department is from the capital city N Djamena, the lower its average MDW Economic inclusion may be better promoted in Chad if oil revenues fit local development needs and are effectively directed to the poorest departments.


")


")
")
")