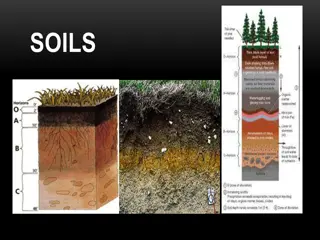
Impact of Soil Depth on Degradation of Plant Protection Products
This study explores the effect of depth beneath the soil surface on the degradation of plant protection products and their metabolites. It discusses the implications for risk assessment and adjustment factors for aerobic degradation based on soil depth. The author's experiences with four compounds and the varying degradation rates in surface and subsoils are analyzed. The findings highlight the importance of considering degradation rates in subsoils for assessing the movement of compounds through the soil profile to groundwater.

Uploaded on Feb 20, 2025 | 5 Views
Download Presentation

Please find below an Image/Link to download the presentation.
The content on the website is provided AS IS for your information and personal use only. It may not be sold, licensed, or shared on other websites without obtaining consent from the author.If you encounter any issues during the download, it is possible that the publisher has removed the file from their server.
You are allowed to download the files provided on this website for personal or commercial use, subject to the condition that they are used lawfully. All files are the property of their respective owners.
The content on the website is provided AS IS for your information and personal use only. It may not be sold, licensed, or shared on other websites without obtaining consent from the author.
E N D
Presentation Transcript
Effect of Depth Beneath the Soil Surface on Degradation of Plant Protection Products and their Metabolites Russell L. Jones June 27, 2017
Outline Introduction Experiences with Four Compounds Laboratory versus Field Studies Closing Thoughts June 27, 2017 2
Introduction Degradation has long been assumed to decrease with depth Reduced soil microbes Laboratory degradation studies Results from prospective ground water studies have indicated that this might not be true for some mobile compounds Difficult to determine in field studies for less mobile compounds due to lack of movement in the field June 27, 2017 3
Introduction Under some circumstances, apparent degradation rates in surface and subsoils may vary for reasons other than soil properties (including depth below the soil surface) Volatilization and photolysis at the soil surface Differences in temperatures (temperatures can be significantly higher for surface applied materials) June 27, 2017 4
Implications for Risk Assessment The degradation rates in subsoils are important factors influencing the potential for a compound to move through the soil profile to ground water Most assessments are conducted assuming rapid decreases with depth in degradation rates. May be appropriate as an initial tier but refinements should be possible when compound-specific data are available June 27, 2017 5
PRZM-GW1.07 Adjustment Factors for Aerobic Degradation Soil Depth (cm) 0-10 10-20 20-40 40-60 60-80 80-100 Below 100 Adjustment Factor 1 0.94 0.78 0.55 0.33 0.11 0 June 27, 2017 6
Introduction The author has conducted prospective studies on four compounds which have shown movement past one meter with significant degradation still occurring, often with little change in degradation rates. Experiences do not include degradation measurements in gravel subsoils or fractured bedrock. These results will be summarized by compound (aldicarb, isoxaflutole, ethoprop, thiodicarb) June 27, 2017 7
Determining Degradation Rates Determining degradation rates as a function of depth in field studies is not straightforward due to downward movement of residues during the study. Different approaches: Sum residues in each depth increment to get a total residues at each time point, then determine decline of overall residues as a function of time. If there has been significant movement of residues and the overall degradation rate is not slowing with time, then the degradation rate with depth is approximately constant. Approach not appropriate when residues are moving below the sample depth. June 27, 2017 8
Determining Degradation Rates Different approaches (continued): Compare degradation rates in different depth increments during time periods when there is minimal movement in soil. Use a model to predict residues as a function of depth and degradation rate (expressed as a function of depth) and chose the description of degradation as a function of depth that best matches the measured data. June 27, 2017 9
Aldicarb The degradation pathway for aldicarb is aldicarb to aldicarb sulfoxide to aldicarb sulfone to non- carbamate residues. The degradation of aldicarb is relatively rapid so after a few days, only aldicarb sulfoxide and aldicarb sulfone remain Degradation rates are usually expressed as the breakdown of aldicarb carbamate residues to non- carbamate residues June 27, 2017 10
Aldicarb Numerous studies where soil samples were collected and residue movement in the unsaturated zone was greater than 1 m U.S.: 17 studies in 8 states Netherlands: 1 study In addition many studies involving collection of soil samples were conducted where the water table was less than 1 m or residues did not move past 1 m Includes studies in the U.S., the Netherlands, and China June 27, 2017 11
Aldicarb Studies were conducted on surface soils and subsoils with a variety of textures and pH values. Too many studies to discuss results in detail General result: degradation rates remained constant as residues moved downward in the soil profile Exception: degradation rates slowed in acidic coarse sand subsoils (but not in alkaline coarse sand subsoils or in acidic fine sand subsoils) June 27, 2017 12
Isoxaflutole The degradation pathway for isoxaflutole is breakdown to the diketonitrile metabolite (DKN or RPA 202248 ) which breaks down to the benzoic acid metabolite (BA or RPA 303328 which breaks down to other metabolites. IFT DKN BA others Only isoxaflutole and DKN are considered biologically active. The degradation rate of IFT is quite rapid (half-life of a day or less) June 27, 2017 13
Isoxaflutole Therefore, the main focus of risk assessments is on the degradation rate of DKN. Results from three PGW studies: In the Nebraska and Iowa studies heavy rainfall during the month after application drove down residues 1.2 m and 0.75 m (NE and IA respectively) into the soil profile which remained relatively immobile until the crop was harvested In the Illinois study, residues moved down to 0.75 m. June 27, 2017 14
Isoxaflutole Results from three PGW studies (continued): No appreciable slowing of degradation with downward movement of residues during the first four months. Also degradation of DKN in the different layers is similar in 1-4 months after application when downward residue movement was minimal. Note that residues of BA were being continually introduced into the layers due to DKN breakdown. June 27, 2017 15
Isoxaflutole Nebraska PGW June 27, 2017 16
Isoxaflutole Iowa PGW June 27, 2017 17
Ethoprop For this discussion, the focus is on parent. Metabolites were also measured in some of the studies. Available PGW studies Two sites in Florida (ridge and flatwoods) Registrant study in the Netherlands: two sites Non-registrant study in the Netherlands June 27, 2017 18
Ethoprop Florida Ridge: Constant degradation rate (half-life of 13 days) but movement to 2 m Flatwoods: half-life of 40 days through 111 days then half-life of 12 days Possible effect of organic matter? 40 days is also the time the surface plastic sheet was removed from the bed, contributing to downward movement of ethoprop June 27, 2017 19
Ethoprop The Netherlands Registrant studies at 2 sites-incorporated application. Site 1: Increase in degradation rate between 60 and 120 days as residues move from 0-20 cm layer into 20-40 cm layer. No movement beyond 40 cm Site 2: No residue movement beyond 20 cm. Similar increase in degradation rate between 60 and 120 days as in site 1. June 27, 2017 20
Ethoprop The Netherlands (continued) Non-registrant study (surface application): For the initial 17 days, the dissipation of ethoprop was faster than the degradation rate between 17 and 104 days-the authors indicated this was due to increased volatilization during this time period. After 104 days the degradation increased (the authors did not indicate why, but this appears to be due to increased degradation rates as a function of depth, similar to that observed in one of the Florida trials). June 27, 2017 21
Thiodicarb Thiodicarb breaks down into methomyl (two molecules of methomyl per molecule of thiodicarb). Because of the rapid degradation of thiodicarb, the main focus of risk assessments is on the degradation rate of methomyl A series of experiments was conducted at Clayton, NC on a Norfolk sandy loam soil where thiodicarb or methomyl were applied between rows of cotton June 27, 2017 22
Thiodicarb Results of experiments Thiodicarb applied to the soil surface: degradation rate corresponding to a half-life of a few hours Methomyl applied to the soil surface: degradation rate corresponding to a half-life of two days Methomyl injected to 0.3 m below the surface: degradation rates corresponding to half-lives of 0.5 to 1.6 months (0-2 and 2-6.3 months) Soil sampled to 1.8 m, no movement of methomyl past 1.2 m June 27, 2017 23
Thiodicarb Results of experiments (continued) The degradation rate between 2 and 6.3 months was relatively constant although the amount of methomyl present above 0.3 m declined At 2 months about 30% of the methomyl was above 0.3 m. In later sampling intervals the amount of methomyl above 3 m ranged 3 to 9 percent of the total methomyl present in the soil profile. June 27, 2017 24
Thiodicarb June 27, 2017 25
Laboratory Versus Field Studies Typically laboratory studies show decreasing degradation rates with soils samples collected at different depths However, in two aldicarb studies, these showed decreasing degradation rates in laboratory studies but did not decrease with depth in field studies conducted on the same field where the laboratory samples were collected. Perhaps because subsoil conditions are not maintained in the laboratory studies, this results in stresses to soil microbes. June 27, 2017 26
Laboratory Versus Field Studies Difficult to get subsoil degradation rates from field studies for less mobile compounds Hard to get such compounds into subsoils under field conditions However, assumptions on degradation rates below 0.5 m as well as that degradation ceases below 1 m can make the difference between an acceptable and unacceptable assessment. In some cases an assumption of a degradation rate of 5 years versus no degradation can change the outcome of an assessment June 27, 2017 27
Closing Thoughts The current EPA parameterization of degradation as a function of depth is conservative but probably appropriate as a starting point. Degradation for at least some compounds does continue for several meters below the soil surface often at rates comparable to those in surface soils. June 27, 2017 28
Closing Thoughts There appears to be no generally accepted rule on how degradation rates change with depth. Instead the correct description appears to be compound specific. Accurately describing degradation in subsoils can be an important factor in assessing whether a plant protection product or its metabolites can move through the soil profile into ground water. June 27, 2017 29
Closing Thoughts Industry would like to work with EPA to develop more realistic approaches based on compound specific information, perhaps including: Use of field data when available for mobile compounds. Design of studies to obtain information on degradation with depth for less mobile compounds such as long term hydrolysis studies. Options for less mobile compounds stable to hydrolysis. June 27, 2017 30