This content discusses the correlation between the wage gap, retirement age, and women's poverty risk, highlighting how single women, widows, and the elderly face financial challenges in retirement due to low lifetime earnings and limited pension coverage. It also explores differential life expectancy between genders, sources of retirement income in the United States, and the impact of Social Security reforms on retirement benefits.
Please find below an Image/Link to download the presentation.
The content on the website is provided AS IS for your information and personal use only. It may not be sold, licensed, or shared on other websites without obtaining consent from the author. If you encounter any issues during the download, it is possible that the publisher has removed the file from their server.
You are allowed to download the files provided on this website for personal or commercial use, subject to the condition that they are used lawfully. All files are the property of their respective owners.
The content on the website is provided AS IS for your information and personal use only. It may not be sold, licensed, or shared on other websites without obtaining consent from the author.
E N D
Presentation Transcript
Effect of the wage gap on retirement age womens poverty risk Martha Susana Jaimes PhD Candidate Public and Urban Policy The New School Workshop Productivity, International Economy and Gender October 8, 2019
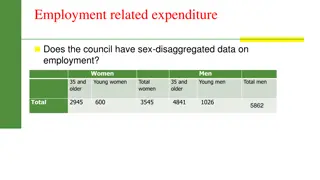
Single Women, Widows, and a Lack of Retirement Security Rates of elder poverty among single women (never married) and widows are higher than among couples and men. Poverty among single women reflects low lifetime earnings and spotty pension coverage. Poverty among widows results from the exhaustion of financial resources
Poverty in Retirement Age Poverty Rate old age 65+ and 80+ 16.0% 13.7% 14.0% 12.0% 10.6% 10.0% 7.7% 7.6% 8.0% 6.0% 4.0% 2.0% 0.0% 65+ 80+ Men Women Source: Author s calculations using United State s 2016 Current Population Survey (CPS)
Differential life expectancy Women have higher life expectancy than men at all ages Life Expectancy 20 At age 65 18 81 At birth 76 0 10 20 30 40 50 60 70 80 90 Women Men Source: Social Security s period life tables for 2017 5
Sources of Retirement Income in the United States Private Savings Pensions: - Defined Benefits - Defined Contribution Social Security Old Age Insurance - Retired Worker benefits - Spousal benefits - Widows/widowers benefits
Social Securitys Old Age Insurance (OAI) Highly regarded as the basic structure of the country s welfare programs, Social Security s design is what classifies the United States as the least generous welfare state of any advanced industrial democracy (Huber and Stephens, 2001:p. 126) The Social Security s structure as social insurance instead of welfare assistance situates the provision of social services and poverty relief as a solution to a market failure (unemployment or low savings) Old age Social insurance is provided as poverty is considered an idividual risk
Social Security reforms affecting claim age 1983 Amendments to SS Act Gradual increase of Full Retirement Age from age 65 to 66 (2003-2009) and to age 67 by 2027. DRC lowered from 72 to 70 starting 1984 1935 1961 Social Security Act Full Retirement Age at 65 Amendments to SS Act Early Age for male retirees lowered to 62 1956 1972 Amendments to SS Act Female workers and wives allowed to claim starting at 62 Amendments to SS Act Delayed Retirement Credit DRC- instituted as a fair compensation for delaying Based on Knoll and Olsen (2014)
Actuarial Adjustments and Claiming behavior will impact Social Security retirement benefits Differential Mortality Rates by Claim Age Estimates using HRS sample of reitred worker benefits claimers Men Female Differential Mortality Rate at age 62 Percentage Difference compared to Base Line Mortality Differential Mortality by Claim Age at 62 Percentage Difference compared to Base Line Mortality Claim Age Claim Age 62 0.0031 0.0023 0.0018 0.0015 62 0.0019 0.0014 0.0015 0.0013 63 -64 26.4% 41.8% 52.4% 63 -64 24.2% 22.7% 31.0% 65 65 66-70 66-70 9
My research question: What is the impact of the United States current retirement structure on female old age poverty? What are the determinants of female poverty risk in old age? Gender gap Life Expectancy Wealth accumulation Are the current rules for Social Security s retired worker benefits contributing (or not) to female s retirement security ? M. Jaimes | June 26, 2019
My hypothesis: 1. Women s old age poverty risk is higher due to less bargaining power derived from the gendered distribution of paid and unpaid work, labor market inequalities, and interrupted work histories. This factors lead to reduced women s retirement security by lowering access to retirement benefits (DB or DC accounts) and accrued income inequality reflects on both lower account balances and lower OAI Social Security benefits. 2. The relation between mortality risk, socioeconomic status and claiming behavior compromises the progressivity of the Social Security benefits formula. 12
The Gender Pay Gap in Retirement Resources Exceeds the Pay Gap Gender Gap Account Balances 37.3% SS Benefits 20.2% Weekly earnings 18.7% 0.0% 5.0% 10.0% 15.0% 20.0% 25.0% 30.0% 35.0% 40.0% Author s calculations using Bureau of Labor Statistics avg. weekly earnings 2017, Social Security average monthly benefit paid at FRA, Survey of Income and Program Participation data for 2014 .
Gender gaps in retirement age These gaps result in women having lower average retirement income (relevant intersectional analysis). The disparity in retirement income does not affect the poverty rate of married couples, which is calculated under the assumption of income pooling between spouses. However, married women are exposed to the risk of substantial income declines upon divorce or the death of a husband. Medical and funeral expenses can go up to 37% of annual income when spouse dies. (Fan and Zick, 2004) Never married woman do not benefit from income pooling or Social Security spousal or widow s benefits
Poverty Incidence in Retirement Age (Old Age, 65+) by gender and marital status 25.7% Never Married 18.8% 16.2% Divorced 15.7% 14.2% Widowed 14.0% 4.5% Married 4.5% 0% 5% 10% 15% 20% 25% 30% Women Men Source: Author s calculations using United State s 2016 Current Population Survey (CPS)
Probability of Married Women Outliving their husbands 78.2% of women in the cohorts 1931-1951 entered retirement as part of a married couple. Most of these women will spend a considerable part of their retirement in widowhood The average age difference with their husbands was 4.2 years Assuming average population mortality for these cohorts, 64.2% will outlive their husbands by an average of 8.5 years.
Marital Status at Age 60 by Gender 90 84.6 78.2 80 Not married 70 60 50 40 30 20 9.3 7.2 6.9 6.8 10 5.3 1.7 0 Married Widowed Divorced or separated Never Married Women Men Source: Author s calculations using Health and Retirement Study Data for cohorts 1931-1951 using HRS sample weights.
Social Security retirement benefit gap Disparities in poverty rates partly reflect the greater prevalence of widowhood among low socioeconomic status women. Social Security benefit formula takes 35 years wage- indexed earnings as starting point. Women are more likely to interrupt work for child and elder (including husband) care, which leads to fewer years in the workforce and lower average earnings. Were it not for the progressivity of the Social Security benefit formula, gender gap in SS benefits would be higher.
Social Security retirement benefit gap Today, married women and men are entitled to three distinct types of Social Security benefits: 1) Benefits based on their own earnings records 2) Spousal benefits 3) Survivor benefits
Claiming behavior HRS Participants in sample Claim Age of Retired Worker Benefits (%) 70 61.95 60 51.8 50 40 30 24.78 19.8 18.4 20 12 10 6.3 5.02 0 62 63-64 65 70 Men Women Author s calculations using HRS administrative data for cohorts 1929-1952
Defined Contribution Account Balances Gap Men ages 55-64 have a median DC balance of $118,000 compared to $74,000 for women. This gap does not reflect disparities in participation rates between men and women workers, which are identical. Gap reflects women s lower lifetime earnings and interrupted work histories.
Data: Health and Retirement Study Health and Retirement Study (HRS) data is a nationally representative longitudinal survey focused on the health status and retirement transitions of older Americans The study interviews participants over age 50 and their spouses -nearly 23,000 households- a total of 39,000 individuals have entered the survey to date. Interviews are done every two years since 1992 and constitutes the main national panel survey with information on retirement and health. I use Social Security administrative data linked to HRS
Data: HRS Administrative Records My study includes Health and Retirement Study (HRS) data for cohorts between 1892 and 1952 Administrative information: Birth date Death date Type of benefits claimed Age at which first benefits are claimed MS. Jaimes | CRR Boston College | 3 April, 2019
Descriptive Analysis - Methodology Calculation of age difference between married couples based on Social Security cohort life tables and HRS sample cohorts. Age difference is calculated for married women born between 1931 and 1951, and their husbands. Using this information I estimate the probability of women outliving their husbands and the average number of years women will remain as widows. Median Non-Housing Wealth based on gender of household head at age 65. Wealth defined as net value of non-housing wealth including real state other than equity in the primary residence. My focus in this initial part of the study is on quantifying the relationship between claim age and subsequent mortality
Gompertz Survival Model and Probit Model I estimate a Gompertz survival model to test mortality risk according to the claim age and socioeconomic status variables (race, gender, occupation, educational level, marital status) The Gompertz is a parametric model commonly used in demography to analyze mortality rates in older ages. Probit model associating claim age and SES variables to study determinants of poverty risk
Conclusions The United States Retirement Crisis: In both cases women will benefit from policy reform that strengthens Social Security and creates Guaranteed Retirement Accounts (GRAs) as a source of independent retirement income lasting a lifetime Proposals to strengthen Social Security to better meet the needs of higher poverty risk groups range from applying incremental changes to the rules for spousal and survival benefits to creating a universal minimum benefit. Policy Note: https://www.economicpolicyresearch.org/jobs-report/old- age-poverty-single-women-and-widows-and-a-lack-of-retirement-security
Thank you Martha Susana Jaimes msjaimes@newschool.edu


")


")