Implementation of the Programme of Action for LDCs in Africa
This document provides key statistics, trade engagement insights, human and social development progress, and other priority areas for least developed countries in Africa. It covers the period from 2011 to 2020, highlighting challenges and improvements in various sectors.

Download Presentation

Please find below an Image/Link to download the presentation.
The content on the website is provided AS IS for your information and personal use only. It may not be sold, licensed, or shared on other websites without obtaining consent from the author.If you encounter any issues during the download, it is possible that the publisher has removed the file from their server.
You are allowed to download the files provided on this website for personal or commercial use, subject to the condition that they are used lawfully. All files are the property of their respective owners.
The content on the website is provided AS IS for your information and personal use only. It may not be sold, licensed, or shared on other websites without obtaining consent from the author.
E N D
Presentation Transcript
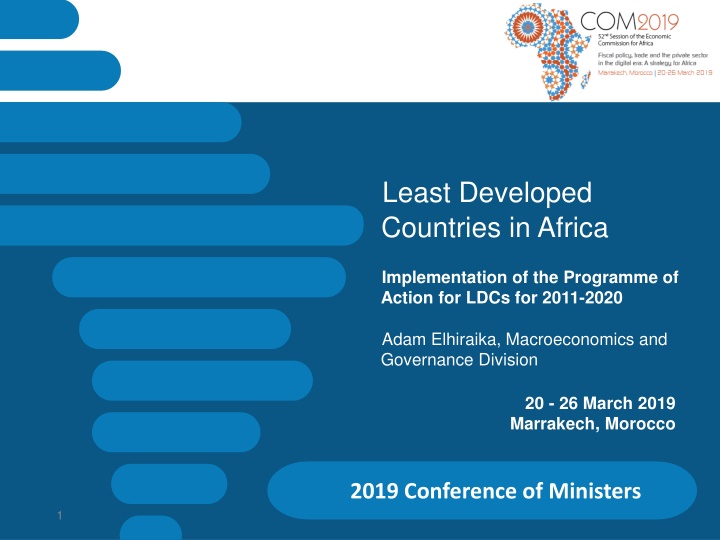
Least Developed Countries in Africa Implementation of the Programme of Action for LDCs for 2011-2020 Adam Elhiraika, Macroeconomics and Governance Division 20 - 26 March 2019 Marrakech, Morocco 2019 Conference of Ministers 1
Overview | LDCs in Africa 2 KEY STATISTICS: 33 of 47 (over 2/3) of the LDCs are located in Africa 654 million people live in African LDCs over 1/2 of total population. Average HDI of African LDCs was 0.473 in 2017; 0.440 in 2010. About 15.7% of Africa s LDC population has access to the Internet (2016), vs. 45.8% of global average Manufacturing value added as a percentage of GDP generally stagnated Sub-region 2011 2012 2013 2014 2015 2016 North Africa 6.1 7.4 6.9 7.4 5.7 6.0 East Africa 7.9 7.5 7.3 7.0 7.1 7.6 West Africa 9.1 8.8 8.5 8.6 8.7 8.4 Central Africa 2.5 2.7 3.3 3.2 3.2 3.3 LDCs in Africa | Implementation of the Istanbul Programme of Action Southern Africa 8.9 UNECA.ORG 8.7 8.2 7.6 8.1 8.7 2
Trade | LDCs in Africa Engagement in world trade is low & declining Share of exports in world trade fell since 2010; picked up from 2016 to 2017. 3 IPoA target is to increase LDCs exports to 2% of world exports, vs 0.6% in 2017 for African LDCs Export concentration (Herfindahl-Hirschman Index) improved from 0.65 in 2008 to 0.36 in 2017 (Herfindahl-Hirschman Index) 0.70 Export concentration 1.2 0.60 merchandise exports 0.50 1 % of total word 0.40 0.8 0.30 0.6 0.20 0.4 0.10 0.2 0.00 2001 2002 2003 2004 2005 2006 2007 2008 2009 2010 2011 2012 2013 2014 2015 2016 2017 0 2010 2011 2012 All LDCs 2013 Asian LDCs 2014 2015 2016 Africa excluding North Africa 2017 Non-LDC African countries African LDCs LDCs in Africa | Implementation of the Istanbul Programme of Action All LDCs UNECA.ORG UNECA.ORG African LDCs 3
Human and Social Development | LDCs in Africa 4 Human Development Improving across African LDCs; Only Togo s HDI has fallen since 2010 Substantial improvements in health outcomes: Under-5 mortality declined from 95 in 1,000 live births in 2011 to 75 in 2017 0.700 0.600 0.500 0.400 HDI 0.300 0.200 0.100 0.000 Liberia Mali Zambia Angola Togo Ethiopia Comoros Lesotho Malawi Niger average Burundi Guinea Burkina Faso Congo, Dem. Rep. Senegal Benin Djibouti Guinea-Bissau South Sudan Uganda Mozambique Sierra Leone Chad Gambia Rwanda Sudan Central African Republic Madagascar Mauritania Sao Tome and Principe Tanzania LDCs in Africa | Implementation of the Istanbul Programme of Action UNECA.ORG UNECA.ORG 2010 2014 2017 4
Other priority areas | LDCs in Africa 5 Resource mobilization and governance Foreign direct investment to African LDCs declined by 47% during 2015-2017; vs. 26% decline for all of Africa. Governance a major challenge: Mo Ibrahim Index of African Governance shows declines on key dimensions, esp. in conflict countries e.g. Central African Republic, Somalia, and South Sudan. LDCs in Africa | Implementation of the Istanbul Programme of Action UNECA.ORG 5
Outlook | LDCs in Africa 6 GRADUATION PROSPECTS Sao Tome and Principe recommended for graduation by the 2018 triennial review. Several African LDCs have potential to start graduation process in 2021. HAI Gap Country GNI per capita (2017) 1880 1280 610 1300 910 Indicates meeting graduation criterion at 2018 review Indicates being within 10 points of meeting a 2nd criteria at 2018 review GNI Gap EVI EVI Gap HAI -8 Djibouti Lesotho Togo Zambia Tanzania 650 50 -620 70 -320 36.3 42 28.3 40.5 27.9 4.3 10 -3.7 8.5 -4.1 58 61.6 61.8 58.6 56 -4.4 -4.2 -7.4 -10 LDCs in Africa | Implementation of the Istanbul Programme of Action UNECA.ORG 6
2020 Regional Review | LDCs in Africa 7 General Assembly Resolution 73/242 calls for a new conference on the LDCs in 2021: 42. Recalls paragraph 157 of the Programme of Action for the Least Developed Countries for the Decade 2011 2020 on holding a Fifth United Nations Conference on the Least Developed Countries [ ] and decides to convene the Fifth United Nations Conference on the Least Developed Countries at the highest possible level, including Heads of State and Government, in 2020 Member states are requested to empower the ECA to organize an African regional review meeting in 2020 to prepare for the 5th United Nations Conference on LDCs. LDCs in Africa | Implementation of the Istanbul Programme of Action UNECA.ORG 7
THANK YOU! Follow the conversation: #COM2019 More: www.uneca.org/cfm2019 8