Explore the use of Artificial Intelligence in enhancing process control within food engineering education, focusing on an inquiry-based approach and simulation-based learning. The methodology involves conceptualization, investigation, and the design of control loops for fermentation processes. Hands-on experiences using MATLAB-Simulink aid in understanding complex dynamics.
Please find below an Image/Link to download the presentation.
The content on the website is provided AS IS for your information and personal use only. It may not be sold, licensed, or shared on other websites without obtaining consent from the author. If you encounter any issues during the download, it is possible that the publisher has removed the file from their server.
You are allowed to download the files provided on this website for personal or commercial use, subject to the condition that they are used lawfully. All files are the property of their respective owners.
The content on the website is provided AS IS for your information and personal use only. It may not be sold, licensed, or shared on other websites without obtaining consent from the author.
Objective implementation of the inquiry-based approach methode using simulation-based learning in teaching process control;
Method framework The inquiry-based learning framework has included five inquiry phases: a) orientation, that means the targets identification; b) conceptualization concerning: laboratory experiments on different fermentation processes, dynamic model building for the fermentation process, feedback control system construction in MATLAB-Simulink computing software; c) investigation comprised: model simulation and validation with the experimental data and tuning the controller parameters; d) conclusion on the obtained results; e) discussion regarded the teaching method used.
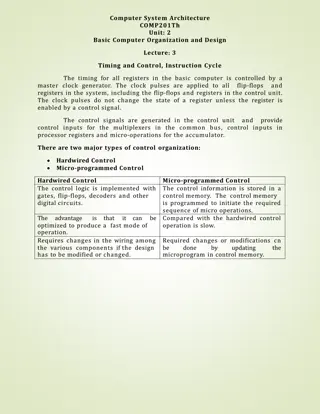
b) Conceptualization and c) Investigation The fermentation process model chosed by the studens is described by a set of non- linear equations corresponding to the physiological phases of yeast cells: substrate, biomass and alcohol dynamic behaviour, heat transfer equations and the dependence of kinetic parameters on temperature. The students will be challenged to find an explanation for their model. With the help of the teacher and of the date obtained from speciality literature they will propose and discuss each of the alternatives. Glucose concentration, S [g L-1]; Alcohol concentration, P [g L-1] ; Biomass concentration, X [g L-1] S P Time, [h] Time, [h] Figure 1: Evolution of glucose and alcohol concentrations; a comparison between experimental values (o - glucose and + - alcohol) and simulation results (continuous lines) Figure 2: Comparison between the biomass simulation results (continuous line) and experimental data (o)
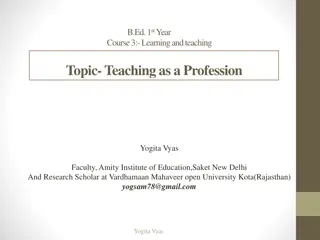
b) Conceptualization and c) Investigation Temperature of cooling agent, T0 ag Temperature in bioreactor, T 0[K]; T0 T0ag [K]; Time, [h] Figure 3: Temperatures of the fermentation medium and cooling agent (simulation results) Then, based on the fermentation process model has been realised a concentration control loop measuring the output concentration of substrate, S. The block diagram of the concentration control is presented in figure 4.
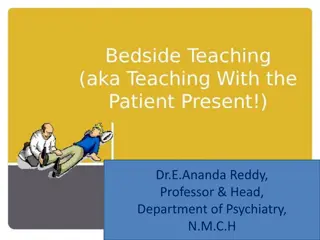
Designing the block diagram in Simulink Figure 4: Block diagram of the concentation control of a fermentation process 1. For the actuating device, a dynamic, analytical mathematical model was written, considering that the input flow in the tap is Fs, the independent variable, the output flow from the tap following the action of the regulator is F, the dependent variable.
Designing the block diagram in Simulink 2. The time constant of the actuating device, which depends on the dimensions of the valve adjusting organ, is v and varies between 0.2 and 2 seconds when the actuating device is part of a control loop, when it receives the input signal from a controller. Thus, it can be written the dynamic equation of control the flow of substrate S in the bioreactor: ?? ??= 1 ???? ? . Based on this model, an S function was formed, with the file name: actuating_device.m
Designing the block diagram in Simulink 3. The same was done for the concentration transducer, where Ss represents the concentration of substrate in the process at time t-1 and S the concentration at time t-1, after the substrate has been separated from the mixture, analyzed, and calculated its concentration by the calculation block of the analyzer. The dead time between the time of sampling (time t-1) and the moment of occurrence of the concentration value of substrate on the computer display shall be denoted by cand shall have values between 10 and 30 seconds. Thus, the equation of the analytical model for the concentration sensor is: ?? ??= 1 ???? ? . Based on this model, an S function was formed, with the file name: transducer.m
Designing the block diagram in Simulink 4. Using the Simulink graphical programming medium, a concentration control loop measuring the output concentration of substrate, S, was created. The block diagram of the concentration control is composed of the following elements: - for the process from the bioreactor, the actuating device and transducer were used S function blocks with reference to the script files, written on the basis of the analytical mathematical models mentioned above; - for the controller, the PID controller block was used. The block parameters for proportional effects (amplification factor Kp), integral (1/Ti) and derivative (Td) were established.
Designing the block diagram in Simulink - Sumator blocks serve as follows: - to polarize the transducer signal (addition the "live zero" at 2 mA c.c.); - for the comparator block. - the Saturation block aims to limit the signal coming from the transducer, xr(t), to the standardized values of the unified current signal [2...10 mA]. The minimum and maximum values have been set in the corresponding boxes: lower output limit and upper output limit. - the MATLAB Function block performs a conversion of the prescribed value from [%] to [mA] according to the relation: ???? % 100 8. ???? ??= 2 +
Designing the block diagram in Simulink - for xref a constant block was used; - for the graphical display, depending on the time, of the evolution of the different signals were used Scope blocks; - for the step-type disturbance occurring at the initial concentration of the substrate was used Step block. In the property box were specified: the time moment of step time application, the initial value, and the final value of the disturbance step signal.
Designing the block diagram in Simulink 5. Using the control loop simulator, the oscillation frequency band and the oscillation period were found using the process test method. Thus: BPosc= 100/72=1.38% and Tosc=0.4 min. It was then proceeded to the optimal granting of the controller parameters using the Ziegler and Nichols method according to the values of the controller parameters in the table below: Controller structure Optimal controller P PI PID parameter PB [%] 2.76 3.04 2.346 Ti[min] Td[min] - 0.332 0.2 - - 0.048
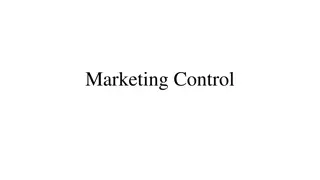
The behavior of the control loop in the three cases of optimal setting are given in figure 5. 4 4 3 3 S [g.L-1] 2 S [g.L-1] 2 1 1 0 0 0 10 20 30 40 50 Time [min] 60 0 10 20 30 40 50 60 a. Time [min] b. 5 4 S [g.L-1] 3 2 1 0 0 10 20 30 40 50 60 Time [min] c. Figure 5: Behavior of the concentration control system in the fermentation process for: a. P controller; b. PI controller and c. PID controller
d) Conclusion As it can be observed in figure 5, the most stabile control of the fermentation process is with P controller. e) Discussionregarding the teaching method used Using the above-described method students can construct more easily and quickly a virtual technological system with the feed-back loop control, which corresponds with a real one. In this way is eliminated the physical realisation of a micro-plant of the technological system who can takes more time. Also, based on the designed virtual technological system can be simulated more situations, extreme situations concerning the parameters' setting of the controller, the controller structure and other aspects of raw materials used in technological process which can introduce unexpected perturbations. In food industry the characteristics of raw materials are very important and, in some ways, uncontrollable.


 Conceptualization and")
 Conceptualization and")


 Conclusion")