Delve into the historical overview of implementing Physical Energy Flow Accounts in the European Statistical System (ESS). Discover key milestones, such as the agreement to develop SEE-type energy accounts and the development of the PEFA questionnaire. Learn about the challenges faced and lessons learned from the implementation process in the European Union over 8 years.
Please find below an Image/Link to download the presentation.
The content on the website is provided AS IS for your information and personal use only. It may not be sold, licensed, or shared on other websites without obtaining consent from the author. If you encounter any issues during the download, it is possible that the publisher has removed the file from their server.
You are allowed to download the files provided on this website for personal or commercial use, subject to the condition that they are used lawfully. All files are the property of their respective owners.
The content on the website is provided AS IS for your information and personal use only. It may not be sold, licensed, or shared on other websites without obtaining consent from the author.
E N D
Presentation Transcript
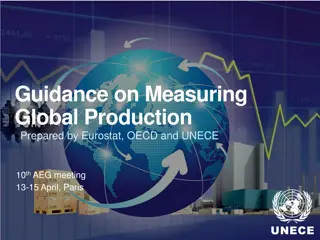
Implementing Physical Energy Flow Accounts in the European Statistical System (ESS) Arturo de la Fuente Eurostat 1
Introduction (historical overview) 2009: Agreement to develop SEEA-type energy accounts in the European Statistical System (ESS) 2009-2010: Discussion paper Eurostat Working Group on Environmental Accounts, choices taken: start with physical flow accounts full-articulated framework of physical supply and use tables (PSUT) detailed industry breakdown (NACE A*64 = same as IOTs) 2010-2014:Task force developed PEFA questionnaire and conceptual guidelines (closely based on SEEA-CF and draft SEEA-Energy) 2
Set of tables in PEFA-questionnaire 2017 Table B.1 - Transformation use of energy flows industries natural energy inputs B.trans energy products E.trans energy residuals N.trans households accumulation rest of world environment Total TTUNI TTUP TTUR Q.trans + Table B.2 - End use of energy flows (including non-energy use) industries households accumulation rest of world environment natural energy inputs energy products E.end F.end energy residuals N.end Total TEUNI TEUP TEUR G.end O.end H.end P.end Q.end Table A - Physical supply table for energy flows industries natural energy inputs energy products C. energy residuals I. Table B - Physical use table for energy flows industries natural energy inputs B. energy products E. energy residuals N. households accumulation rest of world environment Total TSNI TSP TSR households accumulation rest of world environment Total TUNI TUP TUR A. D. L. F. G. O. H. P. J. K. M. Q. Table D - Vectors of key energy indicators industries energy key indicator 1 energy key indicator 7 Table C - Physical use table of emission-relevant use of energy flows (related to fuel combustion) industries households accumulation rest of world environment natural energy inputs B.er energy products E.er F.er energy residuals N.er households accumulation Total TUNIer TUPer TURer Table E - Bridge table energy key indicator (residence principle) Legend: grey cells denote logically impossible cases for PEFA white cells: contain numbers or symbol ':' (not available) capital letters denote sub-matrices (cells) in accordance with SEEA-CF - energy use by resident units abroad + energy use by non-residents on territory = energy key indicator (territory principle) R. 3
Introduction (historical overview) 2012: decision to develop PEFA-Builder = IT-tool populating PEFA-questionnaire from already existing energy statistics (5 Annual Energy Questionnaires) = highly complex algorithms ! 2012-2014: EU legal base 2014: draft PEFA Manual 2014-2016: Voluntary data collections (response rate circa 50%) = learning process 2017: first mandatory data collection 4
Lessons learnt from implementation in EU: Implementation took 8 years! Yet, not all countries established PEFA Quality has to improve in the coming years Many conceptual and methodological issues (beyond SEEA) needed to be clarified and settled PEFA-Builder matured gradually accommodating 'wishes' from countries using this IT-tool requires expert knowledge 5
Lessons learnt from implementation in EU: Policy use of PEFA needs to be sharpened: Currently, energy and climate policy making can widely be informed by energy statistics What is the added value of PEFA? further discussion needed on the potential of PEFA indicators More integrated environmental-economic applications (including monetary accounts and air emissions accounts) e.g. structural decomposition analysis Needed: same detailed industry breakdown as in national accounts (IOTs) 6


")

")