Implementing Two-Sample t-test for Mean Comparison
Learn how to effectively apply the two-sample t-test to compare means between two groups, ensuring proper sample size, normal distribution, and hypothesis testing. Find out about hypotheses, calculating means and standard deviation, and making informed decisions based on the test results.

Download Presentation

Please find below an Image/Link to download the presentation.
The content on the website is provided AS IS for your information and personal use only. It may not be sold, licensed, or shared on other websites without obtaining consent from the author. If you encounter any issues during the download, it is possible that the publisher has removed the file from their server.
You are allowed to download the files provided on this website for personal or commercial use, subject to the condition that they are used lawfully. All files are the property of their respective owners.
The content on the website is provided AS IS for your information and personal use only. It may not be sold, licensed, or shared on other websites without obtaining consent from the author.
E N D
Presentation Transcript
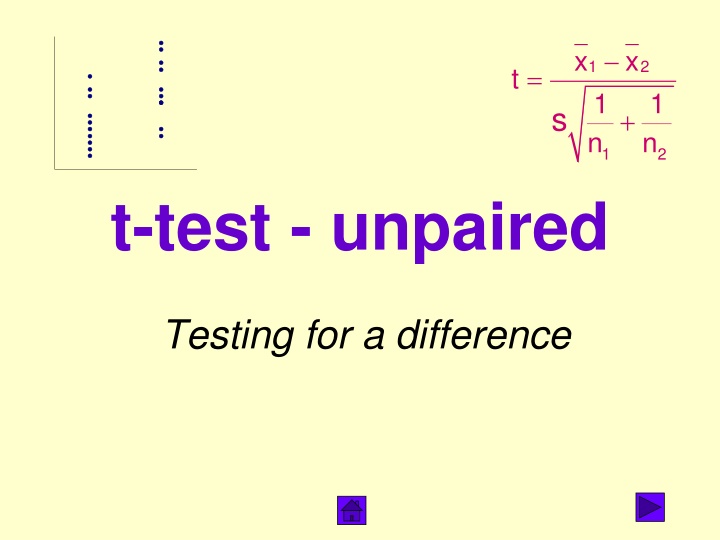
x x 1 2 = t 1 n 1 n s + 1 2 t-test - unpaired Testing for a difference
What does it do? Tests for a difference in means Compares two cases (eg areas of lichen found in two locations) Your two samples do not have to be the same size
Planning to use it? Make sure that You have five or more values in each sample Your data are normally distributed Only continuous data (lengths, weights etc) can be normally distributed You can do a check by seeing if your data look roughly like this: Frequency Value If your data are not normal, use Mann-Whitney If your data are also paired, use paired t-test
How does it work? You assume (null hypothesis) there is no difference between the two means The test works by calculating the means and standard deviations of the two samples, and substituting into a formula.
Doing the test These are the stages in doing the test: 1. Write down your hypotheses 2. Finding the means & standard deviation 3. Use the formula to calculate the t-value 4. Write down the degrees of freedom 5. Look at the tables 6. Make a decision Click here for an example
Hypotheses H0: mean1 = mean2 For H1, you have a choice, depending on what alternative you were looking for. H1: mean1 > mean2 eg: Area of lichen in unpolluted location is greater than area of lichen in polluted location or H1: mean1 mean2 eg: Area of lichen in unpolluted location is different to area of lichen in polluted location Unless you have a good biological reason for expecting one to be larger, you should choose different for H1
Means & Standard Deviation For each sample, find the mean by adding up all the values and dividing by how many there are Find the estimate of the standard deviation s for the two samples, using the formula + = + n1 and n2 = sizes of the two samples and = means of the two samples x12 and x22 = sums of squares of sample values 2 2 2 2 x n x x n x 1 2 1 1 n 2 2 2 s n 1 2 1 x 2 x
Formula Substitute your values into the formula x x t 1 n 1 2 = 1 n s + 1 2 n1 and n2 = sizes of the two samples and = means of the two samples s = estimate of standard deviation 1 x 2 x
Degrees of freedom The formula here for degrees of freedom is degrees of freedom = n1 + n2 2 Where n1, n2 are the sample sizes You do not need to worry about what this means just make sure you know the formula! But in case you re interested the fewer values you have, the more likely you are to get a large t-value by chance so the higher your value has to be to be significant.
Tables Significance levels - note different values for 1 and 2-tailed This is a t table Degrees of freedom
Make a decision If your value is bigger than the tables value then you can reject the null hypothesis. Otherwise you must accept it. Make sure you choose the right tables value it depends whether your test is 1 or 2 tailed: If you are using H1:mean1 > mean 2, you are doing a 1-tailed test If you are using H1: mean1 mean 2, you are doing a 2-tailed test
Example: Lichen areas in polluted & unpolluted locations A student obtained the following data on areas of lichen at a polluted and an unpolluted location Polluted: 300 400 400 330 370 Unpolluted 600 420 540 190 260 800 740 Hypotheses: H0: Mean area at polluted location = mean area at unpolluted location. H1 Mean area at polluted location mean area at unpolluted location
Means & Standard Deviation Polluted sample (sample 1): 1 x = (300 + 400 + 400 + 330 + 370) 5 = 360 x12 = 3002 + 4002 + 4002 + 3302 + 3702 = 655800 n1 = 5 Similarly, for unpolluted sample (sample 2): = 507.14 x22 = 2119300 n2= 7 2 x + 2 2 655800 5(360 ) 2119300 7 2 + 7( 507.14 ) = = s 180. 7 7 5
The test x x 360 507.14 1 5 1 2 = = = t 1.390 1 n 1 n 1 7 s + + 180.77 1 2 Degrees of freedom = 7 + 5 2 = 10 We are doing a 2-tailed test Tables value (5%) = 2.228 Since our value is smaller than the tables value, we accept H0 there s no significant difference in lichen area content