Implications of COVID-19 on Public Transit Policy Planning in Vermont
Explore the short- and long-term impacts of the pandemic on the Greater Vermont Transit system through the lens of the 2020 Public Transit Policy Plan. Discover critical themes, challenges, and key aging statistics shaping the future of public transportation in Vermont's rural areas.

Download Presentation

Please find below an Image/Link to download the presentation.
The content on the website is provided AS IS for your information and personal use only. It may not be sold, licensed, or shared on other websites without obtaining consent from the author. If you encounter any issues during the download, it is possible that the publisher has removed the file from their server.
You are allowed to download the files provided on this website for personal or commercial use, subject to the condition that they are used lawfully. All files are the property of their respective owners.
The content on the website is provided AS IS for your information and personal use only. It may not be sold, licensed, or shared on other websites without obtaining consent from the author.
E N D
Presentation Transcript
Transit Futures: PTPP Section 20 COVID-19 GMT Board May 11, 2020 Stephen Falbel Steadman Hill Consulting
Overview Public Transit Policy Plan 10-year vision covering all of Vermont Completed in February 2020 Section 20 Report Commissioned by legislature in 2019 session Focuses on methods of increasing transit ridership Completed in January 2020 COVID-19 What are the short- and long-term implications of the pandemic for GMT?
Policy Planning in Vermont State law requires policy plans for all transportation modes to be updated every five years The federal government requires a human service transportation coordination plan to be updated every four years For public transit, VTrans combined these efforts into the 2020 Public Transit Policy Plan
Project Tasks Winter 2020 FINAL REPORT Summer-Fall 2018 PROJECT INITIATION Winter 2019 EXISTING CONDITIONS ANALYSIS Winter-Spring 2019 NEEDS ASSESSMENT Summer 2019 RECOMMENDATIONS & IMPLEMENTATION PUBLIC/STAKEHOLDER OUTREACH 4
Primary Needs Identified Lack of transit access in rural areas Lack of resources to meet the needs of vulnerable populations both today and in the future Lack of transportation for access to jobs In areas that have bus routes, improved service levels and connections are needed 5
Critical Themes and Challenges Aging population Economic trends and opportunities Technology and information Public awareness Land use and housing location
Key Aging Statistics Average age of Vermont residents: 42.6 years Third highest in the US, behind Maine and New Hampshire In the next 10 years, the number of Vermonters over 65 will increase by 60% to 175,000 people Fastest growth will be in those over age 80 Some of the most rural counties have the highest percentages of older adults Essex Bennington Windsor Orleans
Policy Challenges Aging Helping older adults make informed choices Age in place or move to a location with easier access to services? Keep driving until it is no longer possible or begin transition to using public transit? Allay fears about future mobility Engage as a volunteer driver Learn about existing options Help to build community support for expanded service
PTPP Strategies Aging Create working committee with Agency of Human Services to address mobility issues for older Vermonters More comprehensive planning for Elders and Persons with Disabilities Transportation Program Set up annual statewide meeting with work plan Share best practices: coordination, low-cost trips, volunteer management Establish Personal Mobility Accounts Expand Ticket To Ride statewide Allow for deposits, gifts and possibly ride credits
Economic Trends & Opportunities Job growth in the past decade restricted to Northwest and Central Vermont Chittenden County accounts for a third of all jobs in Vermont and half of new jobs created since 2008
Public Transit and Employment In urban areas, transit can allow for economic growth without building more roads and parking and can reduce congestion In both urban and rural areas, transit can provide access to jobs for people who cannot drive In rural areas, transit may be the only mobility option for people who cannot afford a car Access to jobs identified as one of the primary themes during the needs analysis from both employer and employee perspectives
PTPP Strategies Employment Increase awareness of carpool/vanpool options through Go Vermont Enlist support of employers in new JobRides program Create late bus for shift workers Expand partnership with Good News Garage Consider partnerships with Uber/Lyft, volunteer groups, where available
Technology and Information Multiple impacts on public transit Real-time information for passengers: Where s my bus? Operational management for transit agencies reliability Mobility on demand, more flexible trip planning Ride-hailing services Limited impact outside of Chittenden County thus far How do they integrate with other public transit? Challenges Not everyone has a smartphone Cellular access/broadband not universally available
PTPP Strategies Technology Create new paradigm for demand response service Work with microtransit companies for software Multi-program integration (Medicaid, E&D, client-pay, etc.) Multi-resource integration (vans, taxis, volunteer drivers, bus routes, TNCs) Use expanded volunteer driver pool as a resource statewide Link to Personal Mobility Accounts
Public Awareness Depends on geography High awareness in Chittenden County Lower awareness in rural areas Depends on age, income and disability Those who can drive don t think much about transit Depends on the type of service Local and commuter bus routes more visible Rural services run less frequently, less visible Volunteer driver services may be totally invisible
PTPP Strategies Awareness Continue investment in Go Vermont Expand capabilities Increase marketing Create interactive map of bus routes VTrans-sponsored project to document stories of the value of public transit Video and audio interviews with beneficiaries Could be used at Town Meetings and elsewhere Continue/expand partnerships and activities Partners include AARP, State agencies, elected officials, Community Transportation Association of America (CTAA), Vermont Public Radio/Television
Land Use and Housing Location 60% of Vermonters live in areas classified as rural Average population density is 68 people per square mile Lowest density: Northeast Kingdom - 32 Highest density: Chittenden County - 299 Vermont has one urbanized area (Burlington) and 19 urban clusters with 2,500-50,000 people each
Policy Challenges Land Use Traditional bus routes viable only in areas with high enough density 3 households or 4 jobs per acre Safe, comfortable and accessible pedestrian environment is essential to public transit routes Sidewalks, crosswalks, safe places to wait for the bus Obstacles to compact development Lack of infrastructure (water and sewer) capacity Zoning bylaws and local opposition Reliance on private-sector initiatives to build housing Coordination with commercial/retail development
PTPP Strategies Transit-supportive development Continue to work with District Commission staff and RPCs to ensure that, as applicable: Transit providers are engaged in the development review process. Multimodal connectivity is considered in both Act250 and the local development review process. Work with state, regional and local agencies to integrate transit into land use planning Density Location Accommodations Promote objectives from Long Range Transportation Plan Maintain and strengthen the vitality of Vermont s villages and downtowns. Make transportation investments that promote active transportation and reduce social isolation.
Climate Change When bus routes are available, fill them up with riders Electrify the transit fleet Award priority scoring to proposed fixed service transit routes that serve Downtowns and Villages Continue to support the Vermont Planning and Development Act (24V.S.A. 4302) Making trips shorter by moving people closer together Allows for more walking trips Promotes more people sharing the same vehicle Reduces the number of miles travelled by vehicles
What did Vermonters Think? PTPP included extensive outreach process 11 regional forums 3 advisory committee meetings 9 stakeholder interviews 9 E&D Committee assessments Numerous other presentations Appearance on VPR s Vermont Edition Project website Two online surveys First round (Fall 2018) on needs: 1,200 responses Second round (Summer 2019) on strategies: 2,200 responses
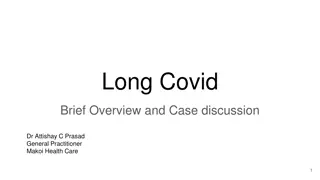
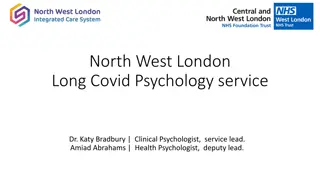
Budgeting Activity 1800 7 1600 6 1400 5 1200 4 1000 Number of Respondents Investing Average Number of Coins Invested 800 3 600 2 400 1 200 0 0 Number of Investors Average Investment
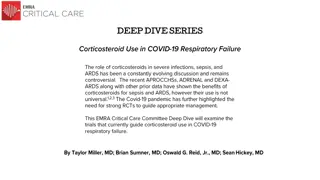
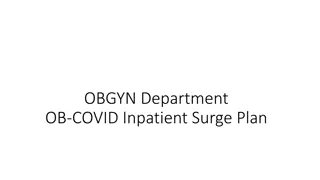
Transit Funding Options Increased Flexing 94% 6% Increased State Funding 90% 10% Private Sector 87% 13% Increased Local Funding 77% 23% 0 200 400 600 800 1000 1200 1400 1600 1800 Number of Responses Agree Disagree
Section 20 Study (H. 529) Goals of the study Study methods to increase use of public transit Special emphasis on rural areas Examine the benefit of providing local connectivity to transit Evaluate what factors affect public transit ridership in Vermont Products of the study Most effective improvements in service and criteria to use to determine the priorities of investments Estimated funding necessary to achieve the improvements
Literature Review Reviewed 11 national and international studies Transit Cooperative Research Program University Transportation Centers Industry journals Community Transportation Association of America reports Conference proceedings Key topics Ridership growth in rural areas Impacts of Transit Intelligent Transportation Systems (ITS) Internal vs. external factors affecting ridership
NCHRP Report on Best Practices Strengthening community awareness and marketing transit service remains a critical part of attracting new riders. Successful rural transit agencies actively manage their services. Old tricks like regional connecting services, university pass programs, and free ride days are still important strategies. New ideas and technologies are creating opportunities to grow rural transit ridership. Partnerships are an essential part of successful rural transit services. Transit agencies can maximize efforts to increase ridership by doing all of these things. State support also essential
Analysis of Vermont Services Looked at highest performing routes Total ridership Highest productivity (riders per unit of service) Identified characteristics of each associated with high performance Then looked at underperforming routes Low ridership Low productivity Identified factors limiting their success
Urban High Performers Successful route Ridership Productivity Characteristics Free fare; wholly within dense area; high frequency (every 15 min) College St Shuttle Major commuter corridor; Fort Ethan Allen; UVM MC; 15-min peak service; high parking charge at destination Essex Junction Highly linear/few alternatives; dense development; high parking charge at destination North Ave Dense development for whole route; tailored service (less during off-peak); serves low-income area Riverside/Winooski Serves major traffic generators (downtown, UVM, Taft Corners and UMall) Williston =high performer; =moderately high performer
Conclusions: High Performance High productivity is often a function of limited or targeted service Only the best transit corridors have high productivity with a high level of service High ridership related to several factors Major trip generators Dense and continuous development Frequent and direct (time-competitive) service In Vermont, ski areas and universities are keys to transit success Low/free fares and rider subsidies also important factors
GMT Low Performers Successful route Ridership Productivity Characteristics Limited service; circuitous routing; Sunday demand GMT Sunday Service Low service level; lack of continuous development; free parking at both ends; poor walking environment in Williston GMT Williston/Essex Limited demand in non-legislative season; overlap with Montpelier Circulator GMT Capital Shuttle =poor performer; =moderately poor performer
Conclusions: Underperformers Small towns and villages may have mobility needs but still not generate enough demand to support a traditional bus route Low service levels not attractive to residents who can drive Pedestrian facilities poor or nonexistent in many non-urban areas Commuter routes face uphill battle in era of low gasoline prices Confusing/poorly designed schedules can be a barrier Capital investment also critical to attract choice riders, but hard to justify in low-density areas Shelters and lighting Cutaways can be a disincentive
Why increase ridership? Make more effective use of existing resources Fill those empty seats Address the unmet needs for mobility Health, job access, life necessities, social interaction Reduce energy use and GHG emissions Reduce congestion and wasted time Free up resources used on automobiles including land used for parking and a lot of money
Methods Short Term Improve local access connections Partnerships with employers, institutions, community orgs. Marketing campaign to change image of transit Tied to climate change, health, freedom, etc. Incentives to ride Further investment in technology and information Capital investments in vehicles and passenger amenities Higher levels of service where density warrants
Methods Longer Term Sidewalks, streetscape, bicycle facilities Planning: actively managing transit service Land use Transit-oriented development Infill housing Growth in town and village centers Paradigm shift in demand response transit
Policy Levers Changing the competitive balance between driving and transit Parking, parking, parking Availability Location Pricing Fuel prices/taxes Fare free transit Total fare revenue for all rural operations in VT: $522K Total fare revenue in Chittenden County: $2.2M
Fare Free Transit TCRP Synthesis 101 Implementation and Outcomes of Fare-Free Transit Systems Commuters in private vehicles are not attracted in large numbers to fare-free public transit. 5% to 30% of new riders formerly used other motorized mode Most new trips made by existing riders using system more Most new riders formerly pedestrians/cyclists or people who would not have made the trip otherwise
Corvallis (OR) Transit System City agency serving 55,000 residents, including 20,000 OSU students Students comprise 43% of all ridership; faculty staff 4% Were already riding fare free through a UPass program Students paid $2.76 fee per term Cash fares were $330K; 14% of $2.4 million budget 10 routes, 60-min headways, carried 2,100 passengers per day Converted to fare free in 2011 Fare revenue replaced by monthly fee on utility bills Individual household as little as $2.75 per month Large businesses up to $1,000 per month Cash fares and student fees were eliminated Also replaced local property tax funding for transit
Corvallis Results First month, ridership increased 24%, second month 43%; total increase for the year was 38% Expected issues with homeless people, but none materialized Transit Operations Fee Currently $3.16/month for single family residential customers $2.18/month for multi-family residential customers Much higher for commercial and industrial customers Based on ITE Trip Generation rates Generated $925,000 in FY2018 Total ridership in FY19: 1.08 million, over 3,000 per day
Comparison to GMT Urban Burlington UZA population larger (108,000) and student population smaller (about 15,000) GMT not a city agency, does not control utility bills GMT Urban fare revenue about $1.6 million (not including Unlimited Access revenue ~$588K) GMT local assessments about $3.2 million
Conclusions on Fares Making all rural service fare free not infeasible, but likely would not increase ridership by a significant amount Density and level of service are more important factors Many rural routes are already fare free or low fare Removing fares from GMT Urban service Would likely increase ridership significantly More use by existing cash fare riders Improved mobility for those who cannot afford the fare Substitute for walking and biking trips Would leave a large hole in the budget Would not have a large impact on traffic
Overall Conclusions Ridership can be increased through investments Planning, marketing/information, capital, service At best, incremental increases would be expected In longer term, land use can make a big difference Major shifts only result from big changes or a crisis mentality Significant policy change regarding parking Substantial increase in fuel prices Attention-grabbing change in climate
Our Current Crisis Starting in mid-March, fifty years of consistent messaging encouraging transit and ridesharing came to a halt Instead of encouraging people to share rides, we had to be discouraged from being close to others Only riders left on transit vehicles were those who had no other mobility options and Who cannot work from home Who are essential employees Who need to travel for basic necessities
Impact on Transit Ridership down significantly Demand response ridership down 72% compared to same period last year Bus route ridership down about 70% Routes that serve shopping areas down less (about 50%) than commuter-oriented routes GMT weekday ridership down 73%, but weekend ridership down only about 55% Service reductions Many routes suspended or replaced with demand response service Statewide about 50% fewer service hours in operation Fare free service on GMT
After the Pandemic How long is the transition back to normal ? Service levels Ridership Has there been a permanent shift in the home/workplace balance? What will be the reduction in the traditional commuting travel market? Messaging Role in the transportation system and community Will there be effects on future land use and development? If any de-urbanization occurs, where will those people go? Will it affect large cities only?
The Permanent Crisis COVID-19 proves that behavior can change in the blink of an eye in a crisis So what about climate change? Can people be convinced that it is as life threatening as a virus? Can the reduction in transportation-related emissions be sustained? Will it get worse than before because no one wants to be in close quarters with others?
Thank you Links to full reports PTPP vtrans.vermont.gov/planning/PTPP Section 20 Report https://legislature.vermont.gov/assets/Legislative- Reports/Section-20-Report-01-07-20-FINAL.pdf 49


")


 Transit System")