Importance of Ongoing Model Maintenance
Continual model maintenance is crucial for ensuring operational efficiency. Changes in economic conditions, population dynamics, and administrative priorities necessitate ongoing assessment of model performance over time. Utilizing techniques such as decile analysis can help in evaluating and improving the model's effectiveness. It is essential to monitor and adapt to changing factors to focus on the targeted population effectively.

Download Presentation

Please find below an Image/Link to download the presentation.
The content on the website is provided AS IS for your information and personal use only. It may not be sold, licensed, or shared on other websites without obtaining consent from the author.If you encounter any issues during the download, it is possible that the publisher has removed the file from their server.
You are allowed to download the files provided on this website for personal or commercial use, subject to the condition that they are used lawfully. All files are the property of their respective owners.
The content on the website is provided AS IS for your information and personal use only. It may not be sold, licensed, or shared on other websites without obtaining consent from the author.
E N D
Presentation Transcript
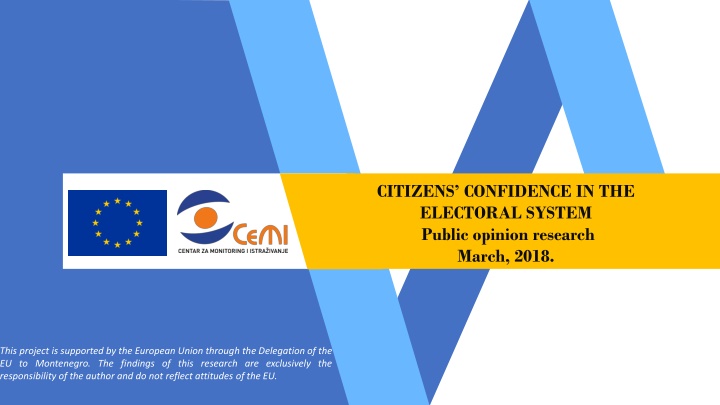
CITIZENS CONFIDENCE IN THE ELECTORAL SYSTEM Public opinion research March, 2018. This project is supported by the European Union through the Delegation of the EU to Montenegro. The findings of this research are exclusively the responsibility of the author and do not reflect attitudes of the EU.
CONTENT: About the project and research Methodology Key findings Research results Contact
About the project and research: Centre for Monitoring and Research (CeMI) is implementing a project titled Let Fair Elections Become a Habit! Building Trust in the Integrity of the Electoral Process in Montenegro. Within this project, CeMI conducted a public opinion research by questioning citizens attitudes about the political situation in the country. The goal of this research is to question the degree of citizens confidence towards the electoral system, by looking at the electoral process, the institutions responsible for conducting elections and political parties. The overall objective of the project is to contribute to a higher level of consolidation of democracy and rule of law in Montenegro. The specific objective is to increase the level of public trust in the integrity of the electoral process, by advocating for adequate changes of institutional and legal electoral framework, in accordance with international standards, thus building a consensus within the political society and organizations in Montenegro. Public opinion research has been conducted on a representative sample the size of 1019 adult citizens of Montenegro. The representative sample is defined as a random three-stage stratified sample. The sample frame is based on the information from the 2011 census and the Stratification of the sample was done on the municipal level, type of estate, age categories and gender. electronic phonebook. civil society Gathering of data was conducted between the 10th of March to the 31st of March 2018. The survey was done using the CATI (Computer-assisted telephone interviewing) method, on the sample of the population that owns a landline telephone in their household. The survey was done over the phone and the average length of the questionnaire was eight minutes. The main target groups of this project are: political parties, electoral management bodies, state authorities, the Parliament which is the Associate on this project, the international community, civil society, citizens with an active right to vote. The project is implemented with the support of the EU.
Methodology Realization: Research conducted in the period from the 10th to the 31st of March 2018 Population of Montenegro 18+, Estimation of the population according to the citizens census from 2011 and statistic data about birth and death in the period from 2011 - 2015 1019 respondents Three-stage random representative stratified sample Stratification: Type of settlement Unit of the first stage: Territory (municipality divided according to the type of settlement), the size is proportional to the number of residents Sample frame: Sample size: Type of sample: Unit of the second stage: Household (selected by random dialing of phone numbers) Unit of the third stage: Respondents within the household (first birthday, combined with quotas by gender and age groups) Type of research: One-time, CATI (telephone survey ), questionnaire (average length 8 minutes) Places of research: 16 municipalities in Montenegro, allocation by municipalities is proportional to the number of citizens Stratification: By gender, age, type of settlement Error: 3.05 % for occurrences with incidence of 50%, level of confidence 95% (marginal error) Incidence 1% 3% 5% 10% 15% 20% 25% 30% 35% 40% 45% 50% Error 0.61% 1.04% 1.35% 1.83% 2.18% 2.44% 2.64% 2.80% 2.91% 2.99% 3.04% 3.05%
Key findings: Based on public opinion research conducted on the representative sample of 1019 respondents, the data shows that approximatelly half of respondents (52.7%) state that they are satisfied with the way democracy works in Montenegro. The number of respondents who are completely satisfied has grown from 9% (2016) to 21% (2018). Most of respondents, 60.2% evaluate that corruption is present in the political system of Montenegro. Respondents that are not members of any political party show a more critical attitude towards the degree of corruption present in the political system. 35.4% of respondents show trust in institutions responsible for conducting elections, compared to 30.7% of respondents that do not have trust and 27.5% of respondents that gave a neutral response to this question. Expressed through the five degree scale, where one is the minimal and five is the maximal grade, the average level of citizens trust equals 2.99. Confidence that the Central Voter Register is up to date and correct, is shown by 42.0% of respondents. Every fourth respondent, precisely 27.7% of respondents do not have confidence, and 24.9% gave a neutral answer. That the Parliamentary elections in 2016 were fair and free, evaluate 45.5% of respondents, compared to 32.6% of respondents who gave a negative answer. More than half of respondents, 58.5% believe the opposition parties should not continue the boycott of the Parliament, compared to 18.4% of respondents who support the boycott.
Key findings: Evaluating the work of electoral institutions on a scale from one to five, the lowest average grade is given to the Agency for Prevention of Corruption (APC) and it equals 2.89. Satisfaction with the work of electoral institutions state between 33.7% and 47.2% of respondents, which points to a relatively insufficient level of satisfaction. Based on the opinion of 70.6% of respondents, the polling board should be composed both of representatives of political parties and officials of local administration. Similarly, 60.7% of respondents evaluate that the State Election Commission should be composed both of representatives of political parties and independent experts, predominantly with experts. More than half of respondents think that it is necessary to regulate by law the obligation of parties to keep records of their members, to introduce procedures for election of party leadership directly by party members and to introduce procedures for the democratic nomination of candidates for MPs. Based on the opinion of 45.1% of respondents, party leadership should be determined on elections where interested citizens could participate as well, which represents a growth in relation to data from 2016, when 32.0% of respondents had the same attitude. That the upcoming, Presidential elections will be free and fair, evaluate 52.4% of respondents, compared to 26.3% of respondents who evaluate the opposite.
Overview of research findings: Democracy in Montenegro Based on data gained from the public opinion research on the representative sample of 1019 respondents, somewhat more than half of respondents (52.7%) state that they are satisfied with the way democracy works in Montenegro, compared to 41.7% of respondents who are not satisfied. A positive change is noted in the perception because in March of 2016, 46% of respondents stated that they were satisfied with the way democracy works. Significant increase in satisfaction of respondents is indicated by information that the number of those who are completely satisfied has grown from 9% (2016) to 21% (2018). 56.6% of respondents from the central region are satisfied with the state of democracy in Montenegro, as well as 50.7% of respondents from the north of the country. In the southern region, satisfaction is expressed by a somewhat smaller number of respondents, where 41.4% of respondents state that they are satisfied with the way democracy works in Montenegro. The distribution of answers is significantly different in relation to categories of nationality, age and party membership. Respondents that state they are currently a member of a political party show a higher degree of satisfaction with the way democracy works (59.4%), compared to those respondents who are not members of any political party (49.0%).
Overview of research findings: Political corruption Most of the respondents, precisely 60.2%, evaluate that corruption is present in the political system of Montenegro. Only 12.6% of respondents state that corruption does not exist, and 9.7% does not know or does not want to respond to this question. Distribution of answers is significantly different in relation to categories of territory (divided by regions), education, nationality and party membership. Respondents that state they are not a member of a political party show a more critical attitude towards the degree of presence of corruption in the political system, where 63.1% state that corruption does exist. Among respondents that say they are a member of a political party, more than half, 54.0% evaluate that corruption is present in the political system. Difference in the attitude towards the presence of corruption in the political system also exists among respondents from different regions. In the south, 65.2% of respondents evaluate that corruption is present, compared to 59.9% of respondents from the central region and 56.8% from the north, who have the same attitude. Respondents with a higher degree of education tend to state that corruption is present in the political system of Montenegro more often.
Overview of research findings: Trust in the institutions of the electoral system Trust in the institutions responsible for conducting elections have 35.4% of respondents, compared to 30.7% of respondents who state they do not have trust and 27.5% of respondents who gave a neutral response to that question. Expressed on the five-degree scale, the average level of citizens trust is 2.99. A higher level of trust is shown by respondents who state they are a member of a political party, so one half of these respondents state they do have trust in the electoral institutions. Among respondents who are not party members, 31.5% state they have trust. Respondents of the Serbian nationality show the smallest degree of trust (16.3%), while among Montenegrins 45.6% of respondents state they have trust in the electoral institutions. Agency for Prevention of Corruption (APC) is evaluated with the lowest average grade (2.89), on the five-degree scale that indicates respondents satisfaction regarding the quality of work of electoral institutions. The average grade of the quality of work of the State Audit Institution is 3.05; For the Constitutional Court 3.08; State Election Commission 3.17; Municipal Election Commissions 3.18; Ministry of Internal Affairs 3.18; Polling boards 3.26; The highest grade 3.4 is given to NGOs for their work during election process monitoring. Satisfaction with the work of the mentioned institutions and organizations state between 33.7% and 47.2% of respondents, which shows a relatively insufficient degree of satisfaction.
Overview of research findings: General rating of the electoral system Trust that the data from the Central Voter Register is up-to-date and correct, have 42.0% of respondents. Every fourth respondent, more precisely 27.7% of respondents, state they do not have trust and 24.9% gave a neutral response. Among the respondents who state they are a member of a political party, 57.2% have trust, which is a significantly higher degree compared to respondents who are not a member of any party (37.4%). That the Parliamentary elections in 2016 were fair and free, evaluate 45.5% of respondents, compared to 32.6% of respondents who gave a negative answer. 17.6% state they cannot estimate, and 4.3% do not know or did not give an answer to this question. On the sample of respondents who answered positively or negatively, 58.3% of respondents have a positive attitude, while 41.7% of respondents show a negative attitude and estimate that the Parliamentary elections were not free and fair. Respondents from the northern and central region show a more positive attitude, as well as respondents who are members of a political party. Distribution of answers varies based on categories of nationality and gender. More than half of respondents, 58.5% think that opposition parties should not continue to boycott the Parliament, compared to 18.4% of respondents who supported the boycott. Distribution of answers varies significantly in relation to: region, education, party membership and nationality.
Overview of research findings: Attitude towards existent legislation According to the opinion of 70.6% of respondents, the polling board should be consisted of both representatives of political parties and local administration officials. Similarly, 60.7% of respondents evaluate that the State Election Commission should be consisted of political parties representatives and independent experts predominantly. 23.2% of respondents evaluate that the SEC should be consisted of independent experts exclusively, while 8.3% of respondents evaluate that the SEC should be consisted of political party representatives exclusively. According to the existing law, just one member of the SEC who is an expert on issues of electoral legislation, is chosen from representatives of the civil society, NGOs and universities. Similarly, 70.6% of respondents evaluate that the polling board should be consisted of both representatives of political parties and local administration officials. According to the existing law, the polling board is consisted of representatives of political parties who are part of the local administration. More than half of respondents think that it s necessary to regulate by law the obligation of parties to keep records of its members, to introduce procedures of electing party leadership directly by party members, and introduce procedures of democratic nomination of candidates to become MPs. There is not a provision in the existing legislation related to the stated obligation of parties, but they can be defined by a party s statute. According to opinion of 45.1% of respondents, party leadership should be elected on elections in which all interested citizens could participate. In relation to data from 2016 (32.0%), there is an increase in number of respondents who believe that all interested citizens should be able to participate in elections for party leadership. Also, there is a noticeable decline in the number of respondents who think that party leadership should be elected at the party s Congress, since it was 29.0% in 2016 and now it is 20.5%.
Overview of research findings: Work evaluation of polling boards Based on the sample of respondents who were members of the permanent composition of a polling board, 64.1% state they are satisfied with the work of the polling board, in which they participated the previous time. The number of respondents in the sample was 99. Based on the sample of respondents who were authorized political party representatives in the polling board, out of 44 respondents 61.1% are satisfied with the work of the polling board, compared to 17.4% who are not satisfied. Among respondents who were observers for a political party at a polling station, 69.4% evaluate the work of the polling board as satisfactory, compared to 12.9% of respondents who are not satisfied with the work of the polling board whose work they monitored the previous time. The number of respondents in the sample was 47. Based on the sample of 8 representatives who were observers at a polling station for an NGO, 63.9% state they are satisfied with the work of that NGO in the process of election monitoring. That the upcoming, Presidential elections will be free and fair, evaluate 52.4% of respondents, compared to 26.3% of respondents who state the opposite. Almost one fifth of respondents (19.6%) cannot estimate, while 1.7% did not give an answer to this question. Distribution of answers varies in relation to categories of gender, nationality and the degree of trust in the electoral system institution.
Generally speaking, how satisfied are you with the way democracy works in Montenegro? 40% 38% 35% 31.5% 29.8% 30% 28% 24% 25% 21.2% 20% 15% 11.9% 9% 10% 5.6% 5% 1% 0% Very unsatisfied Somewhat unsatisfied Somewhat satisfied Very satisfied Does not know march, 2016 N=991; BO=28 (2.8%) march, 2018
Generally speaking, how satisfied are you with the way democracy works in Montenegro? 60% 52.7% 52% 50% 46% 41.7% 40% 30% 20% 10% 5.6% 1% 0% Unsatisfied Satisfied Does not know march, 2016 march, 2018
Generally speaking, how satisfied are you with the way democracy works in Montenegro? Region Age 70.0% 70.0% 59.5% 56.6% 60.0% 60.0% 53.8% 50.7% 48.5% 46.9% 50.0% 50.0% 41.4% 40.0% 40.0% 30.0% 30.0% 20.0% 20.0% 10.0% 10.0% 0.0% 0.0% South Centre North 18 to 24 25 to 44 45 to 64 65 + Somewhat + Very satisfied Somewhat + Very satisfied
Generally speaking, how satisfied are you with the way democracy works in Montenegro? Party membership Nationality 70.0% 70.0% 64.3% 59.4% 60.0% 57.7% 57.2% 57.1% 60.0% 49.0% 50.0% 50.0% 40.0% 40.0% 35.5% 30.0% 27.2% 30.0% 22.80% 20.0% 20.0% 10.0% 10.0% 0.0% Currently member of a party Not a member of a party 0.0% Albanian Montenegrin Muslim Bosnian Croat Serb Other Somewhat + Very satisfied Somewhat + Very satisfied
Do you think corruption is present in the political system of Montenegro? 70.0% 60.2% 60.0% 50.0% 37.1% 40.0% 30.0% 23.1% 17.6% 20.0% 12.6% 9.7% 6.6% 6.0% 10.0% 0.0% Political corruption doesn't exist at all It mostly doesn't exist it doesn't exist both exists and It exists Mostly exists Political corruption completely exists Doesn't know - doesn't want to answer doesnt exist M=3,86; SD=1,229
Do you think corruption is present in the political system of Montenegro? Region Education 80.0% 80.0% 70.0% 70.0% 65.2% 62.4% 60.3% 59.9% 56.7% 56.8% 60.0% 60.0% 50.0% 50.0% 40.0% 40.0% 30.0% 30.0% 20.0% 20.0% 10.0% 10.0% 0.0% 0.0% Without or primary school High school University South Centre North Mostly + Completely exists Mostly + Completely exists
Do you think corruption is present in the political system of Montenegro? Nationality Party membership 90.0% 90.0% 77.3% 75.0% 80.0% 80.0% 69.1% 66.1% 70.0% 70.0% 61.4% 63.1% 55.4% 60.0% 60.0% 54.0% 50.0% 50.0% 40.0% 40.0% 30.0% 30.0% 20.0% 20.0% 10.0% 0.0% 10.0% 0.0% Member of a party Not a member of a party Mostly + Completely exists Mostly + Completely exists
Do you think corruption is present in the political system of Montenegro? Party membership 100.0% 92.5% 91.1% 85.7% 90.0% 80.0% 68.9% 70.0% 62.0% 60.0% 50.0% 42.9% 40.0% 30.0% 20.0% 10.0% 0.0% DPS SD SNP Democrats DF SDP Mostly + Completely exists
How confident are you in the institutions responsible for conducting elections? 40.0% 35.4% 35.0% 30.7% 30.0% 27.5% 25.0% 21.9% 18.7% 20.0% 13.5% 15.0% 12.0% 10.0% 6.3% 5.0% 0.0% I don't have confidence at all I mostly don't have confidence Doesn't have confidence I have confidence and I don't Has confidence I mainly have confidence I completely have confidence Doesn't know or without answer M=2,99; SD=1,319
How confident are you in the institutions responsible for conducting elections? Gender Region 60.0% 60.0% 37.9% 32.8% 40.0% 20.0% 50.0% 0.0% 40.0% 36.5% 36.5% Female Male 31.9% Mostly + completely has confidence 30.0% Party membership 20.0% 60.0% 49.9% 10.0% 31.5% 40.0% 20.0% 0.0% South Centre North 0.0% Mostly + Completely has confidence Member of a party Not a member of a party Mostly + completely has confidence
How confident are you in the institutions responsible for conducting elections? Nationality 50.0% 45.6% 44.3% 45.0% 39.4% 40.0% 35.0% 28.2% 30.0% 25.0% 21.5% 20.0% 16.3% 15.0% 10.0% 5.0% 0.0% Albanian Montenegrin Muslim Bosnian Croat Serb Mostly + completely has confidence
Generally speaking, on a scale of 1 to 5, how do you rate the work of the following institutions? Polling board: Party membership: M=3.26; N=906; BO=113 (11.1%) 60.0% 56.6% 50.0% 43.6% 40.0% 32.5% 30.0% 25.2% 33.8% 23.9% 18.4% 20.0% 12.4% 11.5% 10.0% 0.0% Not Mostly Unsatisfactory Both Satisfactory Mostly satisfactory Completely satisfactory satisfactory at all unsatisfactory satisfactory and unsatisfactory Member of a party Mostly + Completely satisfactory Not a member of a party
Generally speaking, on a scale of 1 to 5, how do you rate the work of the following institutions? Party membership State Election Commission (SEC) M=3.17; N=905; BO=114 (11.2%) 60.0% 51.6% 50.0% 41.9% 40.0% 33.5% 29.2% 28.9% 30.0% 21.9% 20.0% 20.0% 15.9% 13.0% 10.0% 0.0% Not Mostly Unsatisfactory Both Satisfactory Mostly satisfactory Completely satisfactory Member of a party Not a member of a party satisfactory at all unsatisfactory satisfactory and unsatisfactory Mostly + Completely satisfactory
Generally speaking, on a scale of 1 to 5, how do you rate the work of the following institutions? Party membership Municipal Election Commission (MEC) M=3.18; N=915; BO=104 (10.2%) 60.0% 51.7% 50.0% 41.7% 40.0% 33.7% 30.0% 28.4% 30.0% 21.8% 19.9% 20.0% 15.0% 13.4% 10.0% 0.0% Not Mostly Unsatisfactory Both Satisfactory Mostly satisfactory Completely satisfactory satisfactory at all unsatisfactory satisfactory and unsatisfactory Member of a party Mostly + Completely satisfactory Not a member of a party
Generally speaking, on a scale of 1 to 5, how do you rate the work of the following institutions? Agency for Prevention of Corruption (APC) M=2.89; N=896; BO= 123 (12.1%) Party membership 45.0% 45.0% 39.6% 40.0% 40.0% 36.6% 33.7% 35.0% 35.0% 29.6% 30.0% 30.0% 26.7% 23.5% 25.0% 25.0% 18.6% 20.0% 20.0% 15.1% 13.1% 15.0% 15.0% 10.0% 10.0% 5.0% 5.0% 0.0% 0.0% Not Mostly Unsatisfactory Both Satisfactory Mostly satisfactory Completely satisfactory Member of a party Not a member of a party satisfactory at all unsatisfactory satisfactory and unsatisfactory Mostly + Completely satisfactory
Generally speaking, on a scale of 1 to 5, how do you rate the work of the following institutions? State Audit Institution (SAI) M=3.05; N=870; BO= 149 (14.7%) Party membership 45.0% 40.2% 40.0% 36.8% 35.0% 32.0% 31.1% 29.0% 30.0% 25.0% 20.1% 17.5% 20.0% 16.7% 13.6% 15.0% 10.0% 5.0% 0.0% Not Mostly Unsatisfactory Both Satisfactory Mostly satisfactory Completely satisfactory satisfactory at all unsatisfactory satisfactory and unsatisfactory Member of a party Not a member of a party Mostly + Completely satisfactory
Generally speaking, on a scale of 1 to 5, how do you rate the work of the following institutions? Ministry of Internal Affairs (MIA), in connection with the Central Voter Register M=3.18; N=883; BO=136 (13.4%) Party membership 47.4% 50.0% 41.9% 45.0% 40.0% 33.3% 35.0% 30.6% 27.5% 30.0% 25.0% 21.1% 20.8% 16.8% 20.0% 15.0% 10.7% 10.0% 5.0% 0.0% Not Mostly Unsatisfactory Both Satisfactory Mostly satisfactory Completely satisfactory satisfactory at all unsatisfactory satisfactory and unsatisfactory Member of a party Not a member of a party Mostly + Completely satisfactory
Generally speaking, on a scale of 1 to 5, how do you rate the work of the following institutions? The Constitutional Court, regarding its decisions about objections connected to the electoral process M=3.08; N=878; BO=141 (13.8%) Party membership 47.7% 50.0% 45.0% 39.4% 40.0% 31.2% 35.0% 29.3% 30.0% 30.4% 25.0% 19.8% 19.6% 19.0% 20.0% 12.2% 15.0% 10.0% 5.0% 0.0% Not Mostly Unsatisfactory Both Satisfactory Mostly satisfactory Completely satisfactory satisfactory at all unsatisfactory satisfactory and unsatisfactory Member of a party Mostly + Completely satisfactory Not a member of a party
Generally speaking, on a scale of 1 to 5, how do you rate the work of the following institutions? NGOs during election monitoring M=3.37; N=880; BO=139 (13.6%) Party membership 51.1% 47.2% 50.0% 38.7% 40.0% 31.5% 30.0% 24.6% 22.6% 21.3% 20.0% 11.2% 10.1% 10.0% 0.0% Not Mostly Unsatisfactory Both Satisfactory Mostly satisfactory Completely satisfactory Member of a party Not a member of a satisfactory at all unsatisfactory satisfactory and unsatisfactory party Mostly + Completely satisfactory
Generally speaking, on a scale of 1 to 5, how do you rate the work of the following institutions? Comparison of average grades Comparison of positive responses 3.5 47.2% 3.4 50.0% 3.4 39.4%41.7% 41.9% 41.9%43.6% 3.26 3.3 36.8% 40.0% 3.18 3.18 33.7% 3.17 3.2 3.08 3.05 3.1 30.0% 3 2.89 20.0% 2.9 2.8 10.0% 2.7 2.6 0.0%
According to your opinion, who should be a member of the polling board? 80.0% 70.6% 70.0% 60.0% 50.0% 40.0% 30.0% 20.0% 11.0% 10.4% 8.0% 10.0% 0.0% Representatives of political parties Local administration officials Both of those Doesn't know or no response
According to your opinion, who should be a member of the State Election Commission (SEC)? 70.0% 60.7% 60.0% 50.0% 40.0% 30.0% 23.2% 20.0% 8.3% 7.7% 10.0% 0.0% Representatives of political parties exclusively Independent experts exclusively Representatives of political parties and independent experts combined, with mainly the experts Doesn't know or no response
Do you have trust that data from the Central Voter Register is up to date and correct? Party membership 57.2% 60.0% 50.0% 42.0% 37.4% 40.0% 27.7% 30.0% 24.9% 21.9% 20.1% 19.0% 20.0% 8.7% 10.0% 5.5% 0.0% Member of a party Not a member of a party Don't have trust at all Mainly don't have trust Don't have trust Have trust and don't have trust Have trust Mainly have Completely have trust Doesn't know or no response trust Mainly+ Completely has trust
Do you think that the last Parliamentary elections (2016) were free and fair? 70.0% 70.0% 58.3% 60.0% 60.0% 50.0% 45.5% 50.0% 41.8% 40.0% 40.0% 32.6% 30.0% 30.0% 17.6% 20.0% 20.0% 10.0% 10.0% 4.3% 0.0% 0.0% Yes No I cannot estimate Does not know or no response Yes No N=796
Do you think that the last Parliamentary elections (2016) were free and fair? Region Party membership 70.0% 70.0% 58.9% 60.0% 60.0% 47.4% 47.4% 50.0% 50.0% 41.6% 39.2% 40.0% 40.0% 30.0% 30.0% 20.0% 20.0% 10.0% 10.0% 0.0% 0.0% South Centre North Member of a party Not a member of a party Yes Yes
Do you think that the last Parliamentary elections (2016) were free and fair? Nationality Gender 70.0% 70.0% 61.90% 59.1% 57.1% 60.0% 53.7% 53.2% 60.0% 50.1% 50.0% 48.2% 50.0% 40.0% 42.8% 30.0% 40.0% 17.7% 20.0% 30.0% 10.0% 20.0% 0.0% 10.0% 0.0% Female Male Yes Yes
Do you think that the last Parliamentary elections (2016) were free and fair? Party membership Party membership 100% 100% 10.6% 10.7% 11.0% 11.3% 14.5% 90% 90% 24.1% 11.3% 80% 80% 27.5% 30% 70% 70% 60% 60% 34% 72.6% 70.1% 50% 50% 40% 40% 78.0% 61.2% 30% 30% 58.9% 41.6% 20% 20% 10% 10% 16.7% 15.3% 0% 0% Member of a party Not a member of a Vlast Opozicija Ostali Nijesu se izjasnili party Yes No I cannot evaluate+No response Yes No I cannot evaluate + No response
Do you think that the opposition parties should continue to boycott the Parliament? 70.0% 58.5% 60.0% 50.0% 40.0% 30.0% 18.7% 18.4% 20.0% 10.0% 4.4% 0.0% Yes No I cannot estimate Doesn't know or no response
Do you think that the opposition parties should continue to boycott the Parliament? 80.0% 80.0% 69.1% 70.0% 70.0% 62.5% 59.0% 56.0% 60.0% 60.0% 52.2% 50.0% 50.0% 40.0% 40.0% 30.0% 30.0% 24.1% 18.9% 18.0% 20.0% 17.6% 20.0% 15.4% 10.0% 10.0% 0.0% Member of a political party Not a member of a political party 0.0% South Centre North Yes No Yes No
Do you think that the opposition parties should continue to boycott the Parliament? Nationality 80.0% 72.2% 70.2% 69.8% 69.7% 70.0% 60.0% 50.8% 50.2% 50.0% 39.6% 36.1% 40.0% 31.5% 30.3% 30.0% 24.6% 24.5% 17.5% 16.5% 20.0% 14.7% 14.1% 13.1% 12.7% 10.6% 6.5% 10.0% 0.0% 0.0% Albanian Montenegrin Muslim Bosnian Croat Serb Other Yes No I cannot estimate
Do you think that the opposition parties should continue to boycott the Parliament? 100% 6.60% 100% 7.4% 9.8% 18.3% 90% 90% 21.1% 27.8% 24.0% 80% 28.3% 80% 49.30% 70% 70% 64.10% 33.4% 60% 60% 37.6% 47.9% 83.5% 50% 50% 81.1% 51.1% 40% 40% 30.4% 64.2% 30% 30% 48.2% 20% 38.4% 20% 35.9% 31.0% 10% 21.1% 20.3% 10% 9.1% 10.0% 0% 0.0% SD 0% Rulling parties Opposition Other Democrats DF DPS SDP SNP Yes No I cannot evaluate/No response Yes No I cannot evaluate/No response
Do you think that the opposition parties should continue to boycott the Parliament? Nationality 0.0% 100% 10.3% 13.1% 15.5% 15.7% 90% 28.9% 33.2% 80% 70% 36.1% 69.7% 60% 72.2% 39.6% 50% 69.8% 70.2% 50.2% 40% 30% 50.8% 20% 31.5% 30.3% 10% 17.5% 16.5% 14.7% 14.1% 0% Montenegrin Muslim Albanian Bosnian Croat Serb Other Yes No I cannot evaluate
According to your opinion, should the law regulate the obligation of parties to: Keep record of their members: 70.0% 58.6% 60.0% 50.0% 40.0% 30.0% 17.5% 15.6% 20.0% 8.3% 10.0% 0.0% Yes No I cannot estimate Does not know or no response
According to your opinion, should the law regulate the obligation of parties to: Introduce procedures of electing party leadership directly by party members: 70.0% 57.3% 60.0% 50.0% 40.0% 30.0% 19.2% 20.0% 13.6% 9.9% 10.0% 0.0% Yes No I cannot estimate Does not know or no response
According to your opinion, should the law regulate the obligation of parties to: Introduce procedures of democratic nomination of candidates for MPs? 70.0% 61.5% 60.0% 50.0% 40.0% 30.0% 19.3% 20.0% 9.2% 10.0% 1.1% 0.0% Yes No I cannot estimate Does not know or no response
According to your opinion, in which way should party leadership be elected: 50.00% 45.10% 45.00% 40.00% 35.00% 32.00% 29.00% 30.00% 24.00% 25.00% 22.80% 20.50% 20.00% 15.00% 15.00% 11.60% 10.00% 5.00% 0.00% Direct internal-party elections by all party members On elections where all interested citizens could participate On the party's Congress (the highest organ of the party) No response 2016 2018


")
")
")
")