Explore the changes made to enhance RHR calculations and metrics, specifically affecting AGTI1, HOOV1, IKBA1, WHPE1, SWAN1, and LTCC1. Discover insights on data substitution, insect debris issues, and reevaluation of RHR metric codes for improved accuracy during a specific period.
Please find below an Image/Link to download the presentation.
The content on the website is provided AS IS for your information and personal use only. It may not be sold, licensed, or shared on other websites without obtaining consent from the author. If you encounter any issues during the download, it is possible that the publisher has removed the file from their server.
You are allowed to download the files provided on this website for personal or commercial use, subject to the condition that they are used lawfully. All files are the property of their respective owners.
The content on the website is provided AS IS for your information and personal use only. It may not be sold, licensed, or shared on other websites without obtaining consent from the author.
E N D
Presentation Transcript
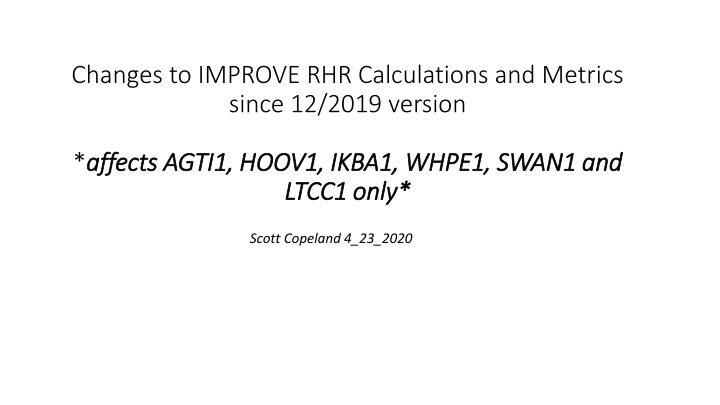
Changes to IMPROVE RHR Calculations and Metrics since 12/2019 version *affects AGTI1, HOOV1, IKBA1, WHPE1, SWAN1 and affects AGTI1, HOOV1, IKBA1, WHPE1, SWAN1 and LTCC1 only* LTCC1 only* Scott Copeland 4_23_2020
The problem: Insect debris clogged inlets of samplers at Chassahowitzka FL, Mingo MO, and Swanquarter NC in the 2003-2005 timeframe. - Much data at all three sites was invalidated, but the QA tests failed to find a problem with the module C data at Swanquarter. Slide from IMPROVE Steering Committee meeting in fall 2005
This plot shows the problematic data. These are the median ratios of OMC and LAC at ROMA1, BRIG1, and LIGO1 to OMC and LAC at SWAN1. Three data points in each plot per month, 1 for each site, each point is the median for that month of OMCSITE/OMCSWAN orLACSITE/LACSWAN. Period with abnormally high ratio is August 2003 through March 2005, shown by vertical lines.
I reran all the RHR metric codes, with each daily OMC or LAC value being multiplied by 2.5 from 8/1/2003 to 4/1/2005. Rerun includes e95 calculation, baseline, NC2, 2064 endpoints, etc. Comparison of SWAN1 MID dv done with daily OMC and LAC scaled by 2.5 during inlet mud clogging 8/1/2003-4/1/2005. Using the 2.5 factor barely changed the MID baseline and 2064 endpoints. There was a slight increase in baseline clearest (visible in plot, but no table provided). 2001-2004 MID Baseline site SWAN1 Before Carbon Adjust 2001-2004 SWAN1 After Carbon Adjust year EAmm_SO4 EAmm_NO3 EOMC 82.212 82.066 ELAC ESoil ECM ESea_Salt haze_dv 3.709 3.654 8.192 9.898 2.677 3.219 0.605 0.611 3.286 3.284 0.157 0.171 23.604 23.790 2001-2004 2064 Endpoints site SWAN1 Before Carbon adjust SWAN1 After Carbon adjust end_point_eamm_so4 end_point_eamm_no3 end_point_esea_salt end_point_eomc end_point_elac end_point_esoil end_point_ecm end_point_episodic_routine_dv 3.392 0.871 0.514 8.412 3.362 0.869 0.515 8.064 0.475 0.720 0.507 0.501 1.810 1.797 10.005 9.924
The Module A data for that period was flagged as invalid, and subsequently filled in by data substitution. This plot shows why I dont think the Module B data at SWAN1 was affected significantly (hence requiring substituting the NO3- data). Same plot of ratios to nearby sites, except done for IC NO3-, IC SO4 and the derived variable Amm_SO4 which is a mixture of XRF S and SO4-. The vertical lines are near, but a bit off of the true period affected.
Site Affected: Lake Tahoe Community College (LTCC1) (not a regional haze tracking site) Issue: 7/1/2014 - 11/17/2015 - the B module stack was "not fully lowered" in the T during that period. Note that if the air at the stack T is like the air at the inlet and no extra nitric acid is getting around the denuder, we would expect the data to be basically the same since it still goes through the cyclone. After examining the period affected and comparing with nearby BLIS1 data, and at the request of an analyst working for the sponsoring agency, I ve passed the data through as valid for daily extinction and RHR metric calculations. Approximate period affected
Changes to IMPROVE RHR Calculations and Metrics after changing only patching routine Scott Copeland 12_19_2019 Results are graphically displayed in Compare 12_2019_1p with 12_2019_2p.pptx Available here https://drive.google.com/open?id=0Bxfj1vyyXeDYWVpfeUo4NEYtTU0
Extended Patching RHR Guidance based patching algorithm was extended to allow up to two missing components of aerosol extinction at one site on one date to be replaced per the guidance technique, rather than just one. The test is performed for each missing component independently, not combinations of missing components as was described in the 2003 guidance. This change is a response to a request by LADCO analysts in 2017 to allow a subset of important sample dates to be used in progress determinations and is a reasonable extension of the guidance technique. This change is the minimum modification to the patching algorithm that can still recover most of the important sample dates at the LADCO sites. About 2200 additional sample dates are recovered at various sites since 2000. At the IMPROVE Steering Committee meeting in Petaluma and at the National Regional Haze meeting in St Louis, I recommended allowing three components per day to be replaced, but changed to two after a careful inspection of the results, especially at high elevation western sites. Every patched or substituted value is now reported explicitly with each data version for each affected site and date. See All_patches_12_19_2p.csv and subs_rhr_5_2019.csv on Google Drive. Reported Data Clearest Days mostly minor-some moderate-one high Most Impaired Days mostly minor-some moderate-one high 2000-2004 Baseline Natural Conditions Estimates 2064 endpoints minor minor minor Significance of change n/a potentially all potentially all next slide next slide potentially all Number of sites affected -
More about the baseline period Below left are all the class I area sites that had at least one observation changed in the baseline period. All of them could have changes to baseline values, natural_conditions2 values, endpoint values, and impairment metrics. In most cases the changes are very small. The largest changes by a wide margin were at MONT1 (Bob Marshall, and Mission Mountains Wilderness) in Montana. The large change at MONT1 results from a few added high fire days that changed the min95 carbon threshold, which then changed the impairment values in most years. Chart site=MONT1 ACAD1 BRET1 DENA1 GRSM1 GUMO1 HALE1 HOOV1 ISLE1 MELA1 MEVE1 MONT1 MOOS1 OKEF1 PASA1 PMRF1 PORE1 SAWT1 SENE1 SHEN1 SNPA1 SULA1 SWAN1 THSI1 TRIN1 TUXE1 UPBU1 WHPE1 YELL2 YOSE1 AGTI1 BRIG1 EVER1 BAND1 BOWA1 BRCA1 CHAS1 CHIR1 GICL1 GRCA2 HAVO1 HEGL1 KAIS1 KALM1 LAVO1 CRLA1 GRGU1 REDW1 SAMA1 SHRO1 SIPS1 TRCR1 WHPA1 VOYA2
Changes to IMPROVE RHR Calculations and Metrics since 10/2019 version before changing patching routine Scott Copeland 12_19_2019 Results are graphically displayed in Compare 10_2019 with 12_2019_1p.pptx Available here https://drive.google.com/open?id=0Bxfj1vyyXeDYWVpfeUo4NEYtTU0
UCD limited data redelivery Several sample dates with erroneously missing XRF values at 8 sites for parts of 2018 were restored. Missing IC data for three days at AGTI1 in 2018 were restored all three days remain invalid for RHR metrics. LOST1 Lostwood NWR, ND - 08/26/2017-12/31/2018, A module only. WICA1 Wind Cave NP, SD - 07/1/2018-12/31/2018, B module only. -> Status flags were set to SA . Data from LOST and WICA are still used provisionally for RHR metric calculation. Cumulative effects of all three issues: Reported Data Clearest Days Most Impaired Days 2000-2004 Baseline Natural Conditions Estimates 2064 endpoints Moderate at PORE1, minor everywhere else n/a n/a n/a Significance of change minor very minor AGTI1, BLIS1, BRCA1, MORA1, PORE1, REDW1, SEQU1, WHPA1, YOSE1 Number of sites affected 9 9 - - - Chart site=PORE1
Modification of legacy status flags at four sites SA *codes were changed to TU * codes for all four modules at 4 sites in 2002 or 2006 after a review of my notes indicated that the SA code had been assigned before the TU code was in use. TU is used to indicate timers that are set up to 24 hours off of the correct time. These reflagged observations are now used for RHR metrics. At AGTI1, SULA1 and KAIS1, adding these days allowed 2006 to meet the completeness requirements, which they previously did not. BALD1 2002 had already been completed through data substitution. Reported Data Clearest Days Most Impaired Days 2000-2004 Baseline Natural Conditions Estimates 2064 endpoints minor minor Significance of change high high high minor AGTI1, SULA1, KAIS1, 2006 and BALD1 2002 AGTI1, SULA1, KAIS1, 2006 and BALD1 2002 AGTI1, SULA1, KAIS1, 2006 and BALD1 2002 AGTI1, SULA1, KAIS1, and BALD1 Number of sites affected BALD1 BALD1 * SA means Sampling Anomaly and is used to describe a wide range of issues including obvious impacts from unusual sources or sampler issues. Data is normally delivered to FED but not used for RHR calculations. * TU is used to indicate controller clocks not set to the correct time. Since the TU flag was created, these observations have been considered valid for RHR metrics. Care should be taken to remove them from analyses that depend directly on the timing of the sample, e.g. comparisons with other monitors.
Typo Corrected a long standing typo in the RHR data patching algorithm. The effect was a small random error in determining whether sea_salt patching was allowed. Only sea_salt patching was affected. Only applicable to a small fraction of observations where sea salt wasn t already valid. Reported Data Clearest Days Most Impaired Days 2000-2004 Baseline Natural Conditions Estimates 2064 endpoints very minor very minor very minor very minor very minor Significance of change n/a potentially all potentially all potentially all potentially all potentially all Number of sites affected -
Addition of new combined haze tracking site RHR metrics now include a SYCA_RHTS site code which is the combined trending site that treats SYCA1 and SYCA2(which began 24OCT2015) as a single site with no data modification. This was based on an analysis that I performed and shared with AZDEQ of the two sites data compared with nearby sites. 2015 is now a complete year for the hybrid site. Reported Data Clearest Days Most Impaired Days 2000-2004 Baseline Natural Conditions Estimates 2064 endpoints n/a n/a n/a Significance of change n/a High high SYCA_RHTS 2015 only SYCA_RHTS 2015 only - - - Number of sites affected -
Addition of EPA 2019 results to my default 2064 endpoint file I am now including the output of the 2019 EPA modeling effort in my 2064 endpoint file for every class I IMPROVE site. This is for convenience in evaluating the numbers for myself and the community. I haven t evaluated the numbers and how they interact with the glide slopes yet. The most recent version of that file is endpoint_2064_imp_g_90_12_19_2p.csv
Modified chloride calculation Chloride algorithm updated prior to 10_19 version to reflect dramatically reduced IC chloride artifact after 2003. Natural Conditions Estimates Most Impaired Days Reported Data Clearest Days Haziest Days 2064 endpoints Significance of change Number of sites affected very minor all very minor all very minor all very minor all very minor all very minor all The old way Chloride=chlf/1000; Chlorine=clf/1000; Sea_Salt=1.8*Chloride; if ((year le 2003) and (chlf < chlf_mdl or chlf=.)) then Sea_Salt=1.8*Chlorine; if ((year gt 2003) and (chlf < chlf_mdl or chlf=.) and (clf ne .)) then Sea_Salt=1.8*Chlorine; A . represents a missing observation The new way


 (not a")