Improvements in CO2 Analysis: Development of NOAA's New Calibration System
Development and enhancements in CO2 analysis focusing on isotopic composition, goals of the new calibration system, considerations for isotopic composition, and calibration strategies using different instruments for improved accuracy.

Download Presentation

Please find below an Image/Link to download the presentation.
The content on the website is provided AS IS for your information and personal use only. It may not be sold, licensed, or shared on other websites without obtaining consent from the author.If you encounter any issues during the download, it is possible that the publisher has removed the file from their server.
You are allowed to download the files provided on this website for personal or commercial use, subject to the condition that they are used lawfully. All files are the property of their respective owners.
The content on the website is provided AS IS for your information and personal use only. It may not be sold, licensed, or shared on other websites without obtaining consent from the author.
E N D
Presentation Transcript
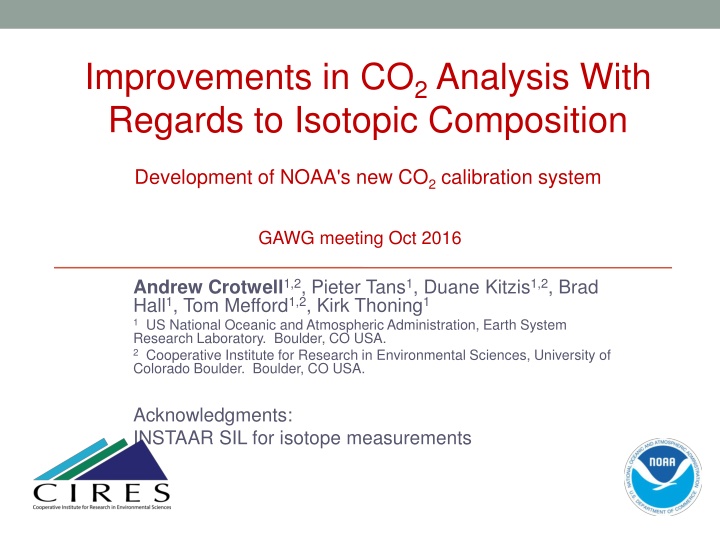
Improvements in CO2 Analysis With Regards to Isotopic Composition Development of NOAA's new CO2 calibration system GAWG meeting Oct 2016 Andrew Crotwell1,2, Pieter Tans1, Duane Kitzis1,2, Brad Hall1, Tom Mefford1,2, Kirk Thoning1 1US National Oceanic and Atmospheric Administration, Earth System Research Laboratory. Boulder, CO USA. 2Cooperative Institute for Research in Environmental Sciences, University of Colorado Boulder. Boulder, CO USA. Acknowledgments: INSTAAR SIL for isotope measurements
WMO X2007 CO2 in air 15 Primary standards (1992) Modified natural air 250 - 520 ppm CO2 13C: -7 to -18 , 18O: 0 to -15 Values determined by manometric measurements LiCor Large Volume MFC VAC P trap 2 {water traps} trap 1 Small Volume
WMO X2007 CO2 in air Transfer of scale by NDIR Primary Secondary Secondary Tertiary 3 or 4 bracketing standards used to calibrate the NDIR system
New Calibration System: Goals Measure total CO2, 13C, and 18O CO2 reproducibility better than 0.01 ppm Currently 0.03 ppm (68% CL) Isotopic values informational only 13C and 18O reproducibility better than 0.25 0.25 13C 0.001 ppm Correctly account for isotopic differences CO2 analyzers may not be equally sensitive to all isotopologues Primary standards: 13C: -7 -> -18 18O: 0 -> -15 FF sourced CO2 standard 13C < -30
Why consider isotopic composition? CO2 analyzers may not be equally sensitive to all isotopologues ex. CRDS measure 626 isotopologue (16O12C16O) only Sample: Total CO2 = 400 ppm, 13C = -8.5 , 18O = -1.5 626 16O12C16O X626 = 393.638 ppm 636 16O13C16O X636 = 4.386 ppm 628 16O12C18O X628 = 1.646 ppm Rare isotopologues = 0.330 ppm Standard: Total CO2 = 400 ppm, 13C = -35 , 18O = -35 626 16O12C16O X626 = 393.814 ppm = 0.176 ppm 636 16O13C16O X636 = 4.270 ppm 628 16O12C18O X628 = 1.591 ppm
New Calibration System: Instruments Picarro, CRDS Measures 626 only Very linear response Aerodyne, QC-TILDAS Measures 626, 636, and 628 isotopologues individually. Non-linear response. Los Gatos Research, Off-Axis ICOS Measures 626, 636, and 628 isotopologues individually. Performance comparable to Aerodyne Better linearity
Calibration Strategy Standards with known Xtotal, 13C, 18O 250 - 520 ppm CO2 Std. X626 Std. X636 Std. X628 Calculate: 626Cal. Curve 636Cal. Curve 628Cal. Curve Measure: Sample X626 Sample X636 Sample X628 Measure: Sample Xtotal, 13C, and 18O Calculate:
Determining Isotopologue Mole Fractions Simple approximation X636 = Xtotal * 13R 13r = (13C/12C) = ( ( 13C / 1000) + 1) * 13rPDB 13R = 13r / (1 + 13r) X628 = Xtotal * 18R Assumes: X636 is independent of oxygen isotopic composition X628 is independent of carbon isotopic composition Xtotal = X626 + X636 + X628 Xiso = f( 13C AND 18O)
Determining Isotopologue Mole Fractions Assume a purely statistical distribution of C and O when making a CO2 molecule: Pick one Carbon atom Pick first Oxygen atom Pick second Oxygen atom All three picks are independent The probability of getting a particular isotopologue (ex. 16O13C16O) is related to the abundance ratios of the carbon and oxygen isotopes.
Example of Probability Function Mixture: 90% Blue and 10% Red. Probability of picking TWO red objects out of FOUR picks? R R B B R B B R R B R B B R B R B R R B B B R R P(2 red) = (nk) * Rredk * Rbluen-k R = abundance ratios n = number of picks (4) k = number of successful picks (2) (nk) = n! / (k! * (n-k)!) where n! = 1 * 2 * 3..*n (42) = 4! / (2! * (4-2)!) = 6 P(2 red) = 6 * 0.12 * 0.9(4-2) = 0.049
Probabilities for picking C and O atoms in CO2 P() = (nk) * R1k * R2n-k Probability of picking ONE 13C for 1 carbon position: P(13C) = (11) * 13R1 * 16R(1-1) P(13C) = 13R 13R 13C / (13C + 12C) Probability of picking ONE 18O out of 2 oxygen positions: P(18O) = (21) * 18R1 * 16R(2-1) P(18O) = 2 * 18R * 16R P(18O) = 2 * 18R * (1 - 18R - 17R) Probability of getting 16O13C18O (638) isotopologue: P(638) = P(13C) * P(18O) P(638) = 13R * 2 * 18R * (1 - 18R - 17R)
Probabilities as Function of Abundance Ratios P(626) = (1 - 13R) * (1 - 18R - 17R)2 P(636) = 13R * (1 - 18R - 17R)2 P(628) = (1 - 13R) * 2 * 18R * (1 - 18R - 17R) P(627) = (1 - 13R) * 2 * 17R * (1 - 18R -17R) 18R = 18O / (18O + 17O + 16O) 13R = 13C / (12C + 13C) 17R = 17O / (18O + 17O + 16O) If we know abundance ratios of a cylinder, probabilities equate to the fraction in the cylinder. Measured delta values are isotopic ratios RELATIVE to a standard reference material. 13r = 13C / 12C 13C = [(13rSMP / 13rPDB) - 1 ] * 1000
Probabilities in Terms of Measured Values Note: in above equations = / 1000 17O = 0.528 * 18O rPDB = atomic abundance ratio of standard reference material 13rVPDB 0.0112372 18rVPDB-CO2 0.002088349 17rVPDB-CO2 0.00039511 Isotopologue mole fraction = Total CO2 * Probability ex. X626 = Xtotal * P(626)
Calibration Strategy Standards with known Xtotal, 13C, 18O 250 - 520 ppm CO2 Std. X626 Std. X636 Std. X628 Calculate: 626Cal. Curve 636Cal. Curve 628Cal. Curve Measure: Sample X626 Sample X636 Sample X628 Measure: Sample Xtotal, 13C, and 18O Calculate:
Calculating 13C and 18O Measured: X626, X636, X628 Know: Xiso = Xtotal * P(iso)
Calibration Strategy Standards with known Xtotal, 13C, 18O 250 - 520 ppm CO2 Std. X626 Std. X636 Std. X628 Calculate: 626Cal. Curve 636Cal. Curve 628Cal. Curve Measure: Sample X626 Sample X636 Sample X628 Measure: Sample Xtotal, 13C, and 18O Calculate:
Target Tank Results: Total CO2 0.006 ppm 0.007 ppm 0.007 ppm 0.006 ppm
Comparison with INSTAAR SIL: 13C 13C 18O Avg. offset 0.03 0.16 Avg. offset -0.25 0.27 Note: INSTAAR SIL measurements are the average of a pair of flasks pulled from the cylinders. 0.01 0.14 -0.84 0.25
CRDS Calibration - NDIR Calibration: X2007 Blue = depleted tanks ( 13C < -15 )
Conclusions New calibration system measures X626, X636, and X628 Statistical distribution used to fully account for isotopic differences between standards Corrects for mole fraction dependent bias in scale transfer Reproducibility: Xtotal = 0.007 ppm 13C = 0.2 18O = 0.2
PC1 626 Calibration Curve Residuals Blue = Linear fit Red = Quadratic fit
636 Response Curve Residuals AR1 Blue = Linear fit Red = Quadratic fit LGR6
WMO X2007 CO2 in air Manometric values corrected for the residuals of a cubic fit of the primaries analyzed by NDIR Residuals on CRDS system Average Manometer values (through 2015) NDIR Residual corrected values
WMO/GAW Central Calibration Laboratory Support WMO/GAW contributing laboratories in answering key scientific question. Ex. source / sink attribution Where? Strength? Are they changing? Global distribution of high-quality long-term measurements. Scale reproducibility is key
Outline WMO X2007 CO2 in air scale New calibration system Isotope accounting method Nomenclature: 16O12C16O 626 16O13C16O 636 16O12C18O 628