Improving Atlantic Basin Tropical Cyclone Intensity Forecasts Analysis
Investigate the trends in Atlantic basin tropical cyclone intensity forecasts from the 67th IHC/2013 Tropical Cyclone Research Forum. Analyze the changes in yearly Atlantic intensity Mean Absolute Error (MAE) and evaluate the implications of best track intensities over the 1990-2011 period. Explore the relative frequency distribution of best track intensity changes from 1990-2000 to 2001-2011 at different time intervals.

Uploaded on Feb 24, 2025 | 0 Views
Download Presentation

Please find below an Image/Link to download the presentation.
The content on the website is provided AS IS for your information and personal use only. It may not be sold, licensed, or shared on other websites without obtaining consent from the author.If you encounter any issues during the download, it is possible that the publisher has removed the file from their server.
You are allowed to download the files provided on this website for personal or commercial use, subject to the condition that they are used lawfully. All files are the property of their respective owners.
The content on the website is provided AS IS for your information and personal use only. It may not be sold, licensed, or shared on other websites without obtaining consent from the author.
E N D
Presentation Transcript
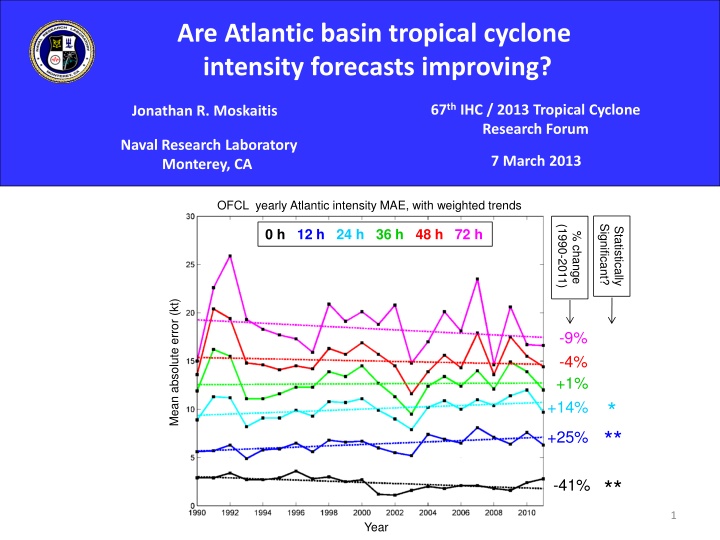
Are Atlantic basin tropical cyclone intensity forecasts improving? 67th IHC / 2013 Tropical Cyclone Research Forum Jonathan R. Moskaitis Naval Research Laboratory Monterey, CA 7 March 2013 OFCL yearly Atlantic intensity MAE, with weighted trends Significant? (1990-2011) 0 h 12 h 24 h 36 h 48 h 72 h Statistically % change Mean absolute error (kt) -9% -4% +1% * +14% ** +25% ** -41% 1 Year
Introduction In order to understand the OFCL intensity MAE trends, it is necessary to consider how both the statistics of the forecasts and the statistics of the best track analyses have changed over the years. OFCL yearly Atlantic intensity MAE, with weighted trends Significant? (1990-2011) 0 h 12 h 24 h 36 h 48 h 72 h Statistically % change Mean absolute error (kt) -9% -4% +1% * +14% ** +25% ** -41% 2 Year
Objective (1) Investigate best track intensities over the 1990-2011 period in order to discern if significant changes to the statistics of the verifying analyses have taken place (2) Evaluate the implications of the evolution of the best track intensity statistics over the years for the interpretation of the OFCL intensity MAE trends Data: ATCF a-decks and b-decks Intensity change: Irene (2011) best track intensity Best track intensity change I = 30 kt t = 96 h Best track intensity change time interval 3
Best track intensity change: 1990-2000 vs. 2001-2011 I relative frequency distribution, t = 12 h Lower relative frequency of small-magnitude intensity changes for 2001-2011 than for 1990-2000 Higher relative frequency of large-magnitude intensity changes for 2001-2011 than for 1990-2000 4
Best track intensity change: 1990-2000 vs. 2001-2011 I relative frequency distribution, t = 24 h Lower relative frequency of small-magnitude intensity changes for 2001-2011 than for 1990-2000 Higher relative frequency of large-magnitude intensity changes for 2001-2011 than for 1990-2000 5
Best track intensity change: 1990-2000 vs. 2001-2011 I relative frequency distribution, t = 48 h Lower relative frequency of small-magnitude intensity changes for 2001-2011 than for 1990-2000 Higher relative frequency of large-magnitude intensity changes for 2001-2011 than for 1990-2000 6
Best track intensity change: 1990-2000 vs. 2001-2011 I relative frequency distribution, t = 72 h Lower relative frequency of small-magnitude intensity changes for 2001-2011 than for 1990-2000 Higher relative frequency of large-magnitude intensity changes for 2001-2011 than for 1990-2000 7
Best track intensity change: 1990-2000 vs. 2001-2011 I relative frequency distribution, t = 72 h -h2 -h1 h1 h2 RFS = Relative frequency of small-magnitude intensity change, | I | h1 RFL = Relative frequency of large-magnitude intensity change, | I | h2 8
Best track intensity change: Trends in yearly samples t = 12 h t = 24 h Relative frequency of small-magnitude intensity change (RFS) Relative frequency Relative frequency of large-magnitude intensity change (RFL) % change (1990-2011) t RFS RFL 6 h -23** 90* t = 48 h t = 72 h Relative frequency 12 h -37** 138* 24 h -29** 86* 36 h -17 117* 48 h -8 126* 72 h -10 70 96 h -18 78 Year Year 120 h -10 93 For all t, the trend indicates decreasing relative frequency of small-magnitude intensity changes and increasing relative frequency of large-magnitude intensity changes 9
Best track intensity change: Trends in yearly samples Yearly AAIC with weighted trend, t = 12, 24, 36, 48, 72 h AAIC = Average absolute intensity change 12 h 24 h 36 h 48 h 72 h % change (1990-2011) t AAIC +21% 6 h 46** 12 h 44** +21% 24 h 32* * +25% 36 h 25* 48 h 21 +32% * 72 h 21 96 h 23 ** +44% 120 h 19 Significant? (1990-2011) Statistically % change For all t, there is an increasing trend in AAIC 10
Best track intensity change: Relationship with OFCL intensity MAE AAIC can be interpreted as a measure of forecast difficulty AAIC = MAE of persistence intensity forecasts How does AAIC compare to OFCL intensity MAE? AAIC for t = 12 h and OFCL MAE for lead time = 12 h AAIC for t = 24 h and OFCL MAE for lead time = 24 h +44% weighted trend (kt) Yearly value and +32% +25% +14% Standardized residuals = 0.72 = 0.87 11
Best track intensity change: Relationship with OFCL intensity MAE AAIC can be interpreted as a measure of forecast difficulty AAIC = MAE of persistence intensity forecasts How does AAIC compare to OFCL intensity MAE? AAIC for t = 12 h and OFCL MAE for lead time = 48 h AAIC for t = 24 h and OFCL MAE for lead time = 72 h +21% weighted trend (kt) +21% Yearly value and -9% -4% Standardized residuals = 0.81 = 0.61 On the decadal time scale, AAIC (forecast difficulty) and OFCL MAE have different trends. The slope of AAIC trend > slope of OFCL MAE trend. Year-to-year departures from the trend lines are highly correlated, suggesting the AAIC departure controls the OFCL MAE departure. 12
Best track intensity change: Relationship with OFCL intensity MAE Normalized MAE = OFCL MAE / AAIC Accounts for forecast difficulty, as measured by AAIC 48 h * -13% * -21% 12 h 72 h * -14% * -23% 24 h For all lead times, there is a statistically significant decreasing trend in normalized MAE * -20% 36 h 13
Summary and conclusions Analysis of Atlantic best track intensities during the 1990-2011 period shows: Decreasing trend in relative frequency of small-magnitude intensity changes (RFS) Increasing trend in relative frequency of large-magnitude intensity changes (RFL) Increasing trend in average absolute intensity change (AAIC) Trends in OFCL intensity MAE should be interpreted in context of the AAIC, to account for evolution in the statistics of the best track intensities on the decadal time scale AAIC can be interpreted as a measure of forecast difficulty After normalizing by AAIC, OFCL intensity MAE shows statistically significant decreasing trends at 12, 24, 36, 48, and 72 h Question for future research: Why are there trends in AAIC, RFS, and RFL? 14