Improving Course Design Through Cognitive Task Analysis
Such analysis helps instructors identify better ways to support learning of the content, uncovering hidden skills and addressing learner difficulties often overlooked due to expert blind spots. By understanding the challenges faced by learners, especially in symbolizing mathematical problems, instructors can design more effective teaching strategies. Close-the-loop experiments in Educational Data Mining can further enhance the evaluation process, ensuring better student learning outcomes.

Download Presentation

Please find below an Image/Link to download the presentation.
The content on the website is provided AS IS for your information and personal use only. It may not be sold, licensed, or shared on other websites without obtaining consent from the author.If you encounter any issues during the download, it is possible that the publisher has removed the file from their server.
You are allowed to download the files provided on this website for personal or commercial use, subject to the condition that they are used lawfully. All files are the property of their respective owners.
The content on the website is provided AS IS for your information and personal use only. It may not be sold, licensed, or shared on other websites without obtaining consent from the author.
E N D
Presentation Transcript
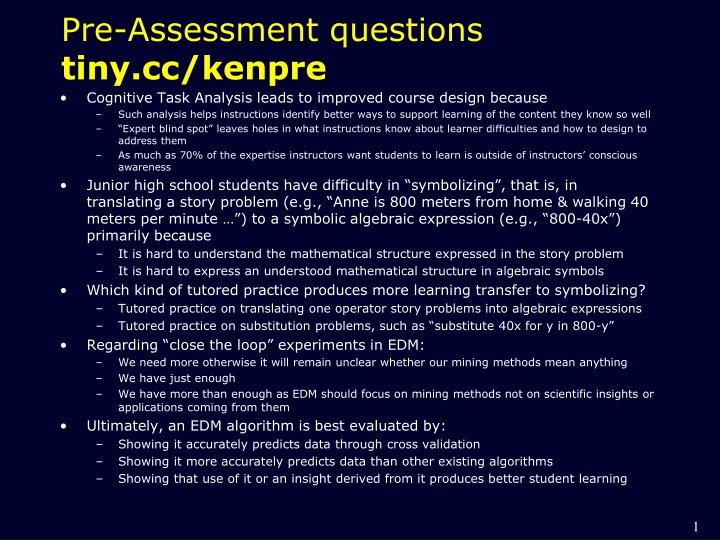
Pre-Assessment questions tiny.cc/kenpre Cognitive Task Analysis leads to improved course design because Such analysis helps instructions identify better ways to support learning of the content they know so well Expert blind spot leaves holes in what instructions know about learner difficulties and how to design to address them As much as 70% of the expertise instructors want students to learn is outside of instructors conscious awareness Junior high school students have difficulty in symbolizing , that is, in translating a story problem (e.g., Anne is 800 meters from home & walking 40 meters per minute ) to a symbolic algebraic expression (e.g., 800-40x ) primarily because It is hard to understand the mathematical structure expressed in the story problem It is hard to express an understood mathematical structure in algebraic symbols Which kind of tutored practice produces more learning transfer to symbolizing? Tutored practice on translating one operator story problems into algebraic expressions Tutored practice on substitution problems, such as substitute 40x for y in 800-y Regarding close the loop experiments in EDM: We need more otherwise it will remain unclear whether our mining methods mean anything We have just enough We have more than enough as EDM should focus on mining methods not on scientific insights or applications coming from them Ultimately, an EDM algorithm is best evaluated by: Showing it accurately predicts data through cross validation Showing it more accurately predicts data than other existing algorithms Showing that use of it or an insight derived from it produces better student learning 1
Closing the Loop with Quantitative Cognitive Task Analysis Ken Koedinger pact.cs.cmu.edu/koedinger.html Professor of Human-Computer Interaction Carnegie Mellon University & Mimi McLaughlin Director of learnlab.org PI of learnsphere.org Educational Data Mining July 2, 2016 2
Experts can describe only 30% of what they know! (Clark et al) What we know about our own learning What we do not know we know => Instructor-based intuitive design lacks information and thus is flawed 3
Cognitive Task Analysis uncovers hidden skills => improves instruction Cognitive Task Analysis (CTA) Methods Structured interviews, think alouds of experts Studies: Traditional instruction vs. CTA-based Med school catheter insertion (Velmahos et al., 2004) Radar system troubleshooting (Schaafstal et al., 2000) Spreadsheet use (Merrill, 2002) Lee (2004) meta-analysis: 1.7 effect size! 4
Quantitative Cognitive Task Analysis (CTA) Complementary to qualitative CTA Pro: Greater reliability & less costly Con: Harder to interpret than interview CTA data Quantitative CTA methods Difficulty Factors Assessment Students better at story problems than matched equations => tutor redesign better in close-the-loop (Koedinger & Anderson, 1998) Statistical models of learning (BKT, AFM, PFA, ) Discovered hidden planning skills in geometry area => tutor redesign better in close-the-loop Automating model search in Learning Factors Analysis => close-the-loop coming 5
There isnt much E in EDM without interpretation! 3 ways model interpretation improves educational theory & practice 1. Advances scientific understanding of learning or of domain content 2. Facilitates generalization of models to new data sets (cf., Liu , EDM14) 3. Produces insights that lead to improved ed tech design 6
Assumptions behind of Quantitative Cognitive Task Task difficulty variation => KC inferences KC s predict learning transfer & guide better instructional design Assumption is present in logistic regression (AFM) & BKT family models of learning curves The same KC matrix is used for both task difficulty ( or L0) learning transfer ( or T) Models using same KC matrix to predict difficulty and transfer produce better results than using separate matrices (item vs. KC) Koedinger, Yudelson & Pavlik (in press). Testing theories of transfer using Error Rate Learning Curves. Topics in Cognitive Science Special Issue. Goal: further investigate this difficulty-transfer linkage claim 7
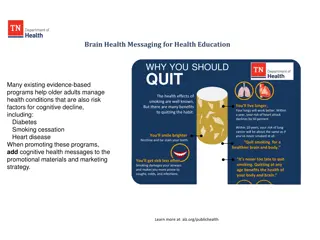
AFM: KC model (Q) is used for both difficulty ( ) & transfer ( ) prediction GIVEN: ESTIMATED: i = proficiency of student i k = difficulty of KC k k = gain for each practice opportunity on KC k pij = probability student i gets step j correct Qkj = each knowledge component k needed for this step j Tik = opportunities student i has had to practice k Cen, Koedinger, & Junker (2006) Draney, Pirolli, & Wilson (1995) Spada & McGaw (1985) 8
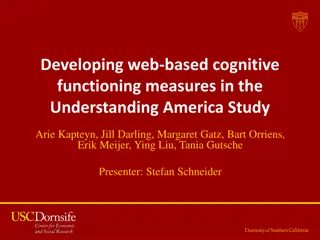
What can we do to improve learning of symbolizing? 2_step 1_step 1_step substitution Ms. Lindquist teaches 62 girls. Ms. Lindquist teaches f fewer boys than girls. Write an expression for how many students Ms. Lindquist teaches. Ms. Lindquist teaches 62 girls. Ms. Lindquist teaches b boys. Write an expression for how many students Ms. Lindquist teaches. Ms. Lindquist teaches 62 girls. Ms. Lindquist teaches f fewer boys than girls. Write an expression for how many boys Ms. Lindquist teaches. Substitute 62-f for b in 62+b Write the resulting expression. 62+62-f 62+b 62-f 62+62-f 10
Example problem continued showing substitution scaffold within problem 12
In Vivo Experiment Design N = 714 middle school students Original study: N = 303 in 2008-9 Enlarged sample: N = 411 from 2009-12 Random assignment Treatment = substitution practice Control = 1 operator story practice Study during 1 class period Pre-test, instruction, & post-test embedded in a single problem set 13
Treatment & Form Variations Covariate: Pre-test [See rows 1-5] Target factor: Condition: 1_step v. subst [6,7,9,11] Context factors: Order: EH v. HE, version: A v. B, study-year: 8 v.9-12 Outcome variable: 2_STEP story problems [8, 10, 12] 14
Results 5 factor ANCOVA Main effects condition F(1,679)=4.5, p<0.05, d = .21 pre-test, order, version Two-way interactions pre-test*condition F(1,679)=4.0, p<0.05 pre-test*order order*year No other higher-level interactions 15
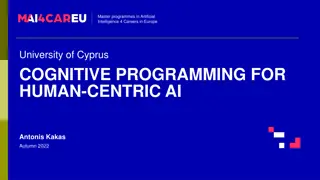
Interaction is theoretically sensible Transfer of Composition Skill 0.6 2_step story transfer post-test 1_step story 0.5 substitution 0.4 0.3 0.2 0.1 0 0 0.2 Pre-test proportion correct 0.4 0.6 0.8 1 80% of students have 1_step competence & better learn 2_step from substitution practice
Computing composition difficulty: Is whole (2 steps) greater than sum of parts (1 steps)? Composition Effect Subst transfer Problem name 2_step solution 1_step (a) 1_step (b) a*b 2_step a*b - 2_step 2_step/(a*b) trip 550/(h-2) 0.65 0.78 0.51 0.11 0.40 0.22 0.08 class 62+62-f 0.75 0.7 0.53 0.13 0.40 0.25 0.12 jackets d-1/3*d 0.58 0.54 0.29 0.16 0.13 0.56 -0.02 sisters (72-m)/4 0.71 0.63 0.45 0.32 0.13 0.72 0.15 rowboat 800-40m 0.7 0.55 0.38 0.28 0.10 0.73 0.07 children (972+b)/ 5 5*12*c 0.66 0.75 0.5 0.38 0.12 0.76 0.09 cds 0.71 0.74 0.52 0.52 0.00 1.00 0.14 mcdona 5*h-7 0.66 0.85 0.56 0.72 -0.16 1.29 -0.06 6 problems show a composition effect 2 problems do not frequent forms mx+b, a*b*x 17
Does difficulty correlate with transfer? Substitution Transfer for Prepared Students 1 0.9 1_step story 0.8 Proportion correct substitution 0.7 0.6 0.5 0.4 0.3 0.2 0.1 0 No Comp Effect (2 problems) 5*h-7 Comp No Parens (3 problems) Post-test Problem Type d-1/3*d Comp Parens (3 problems) 550/(h-2) Transfer occurs for problems showing a composition effect Stronger when parentheses are involved But oddly the no paren problems are harder
AFM: KC model (Q) is used for both difficulty ( ) & transfer ( ) prediction GIVEN: ESTIMATED: i = proficiency of student i k = difficulty of KC k k = gain for each practice opportunity on KC k pij = probability student i gets step j correct Qkj = each knowledge component k needed for this step j Tik = opportunities student i has had to practice k Cen, Koedinger, & Junker (2006) Draney, Pirolli, & Wilson (1995) Spada & McGaw (1985) 19
Discovering new KC models Recursive grammar skill for 2_step & substitution Item stratified CV (RMSE) Paren skill Double- ref skill KCs No- 3 0 0 0 0.429 transfer Substituti on 3 1 0 0 0.426 transfer Paren- enhanced Double- 4 1 1 0 0.428 ref- 5 1 1 1 0.416 enhanced Next iteration of quantitative CTA: 1) Design instruction to address double ref difficulty 2) Close-the-loop experiment 20
Summary Quantitative Cognitive Task Analysis Difficulty Factors Assessment, Learning Curve Analysis Such data is easier to collect & less subjective than qualitative CTA data, such as interviews Task difficulty variation => KC inferences Use same KC model (Q) to explain both difficulty and learning transfer There isn t much E in EDM without interpretation! 21
Pre-Assessment questions tiny.cc/kenpost Cognitive Task Analysis leads to improved course design because Such analysis helps instructions identify better ways to support learning of the content they know so well Expert blind spot leaves holes in what instructions know about learner difficulties and how to design to address them As much as 70% of the expertise instructors want students to learn is outside of instructors conscious awareness Junior high school students have difficulty in symbolizing , that is, in translating a story problem (e.g., Anne is 800 meters from home & walking 40 meters per minute ) to a symbolic algebraic expression (e.g., 800-40x ) primarily because It is hard to understand the mathematical structure expressed in the story problem It is hard to express an understood mathematical structure in algebraic symbols Which kind of tutored practice produces more learning transfer to symbolizing? Tutored practice on translating one operator story problems into algebraic expressions Tutored practice on substitution problems, such as substitute 40x for y in 800-y Regarding close the loop experiments in EDM: We need more otherwise it will remain unclear whether our mining methods mean anything We have just enough We have more than enough as EDM should focus on mining methods not on scientific insights or applications coming from them Ultimately, an EDM algorithm is best evaluated by: Showing it accurately predicts data through cross validation Showing it more accurately predicts data than other existing algorithms Showing that use of it or an insight derived from it produces better student learning 22


 is used for both")


 is used for both")