Improving Data Accuracy in Deaf-Blind Child Count Reporting
Enhance your understanding of National child count reporting processes, data management best practices, and strategies for cleaning DB child count data for improved accuracy. Find out submission details and data notes examples to ensure accurate reporting.

Download Presentation

Please find below an Image/Link to download the presentation.
The content on the website is provided AS IS for your information and personal use only. It may not be sold, licensed, or shared on other websites without obtaining consent from the author. If you encounter any issues during the download, it is possible that the publisher has removed the file from their server.
You are allowed to download the files provided on this website for personal or commercial use, subject to the condition that they are used lawfully. All files are the property of their respective owners.
The content on the website is provided AS IS for your information and personal use only. It may not be sold, licensed, or shared on other websites without obtaining consent from the author.
E N D
Presentation Transcript
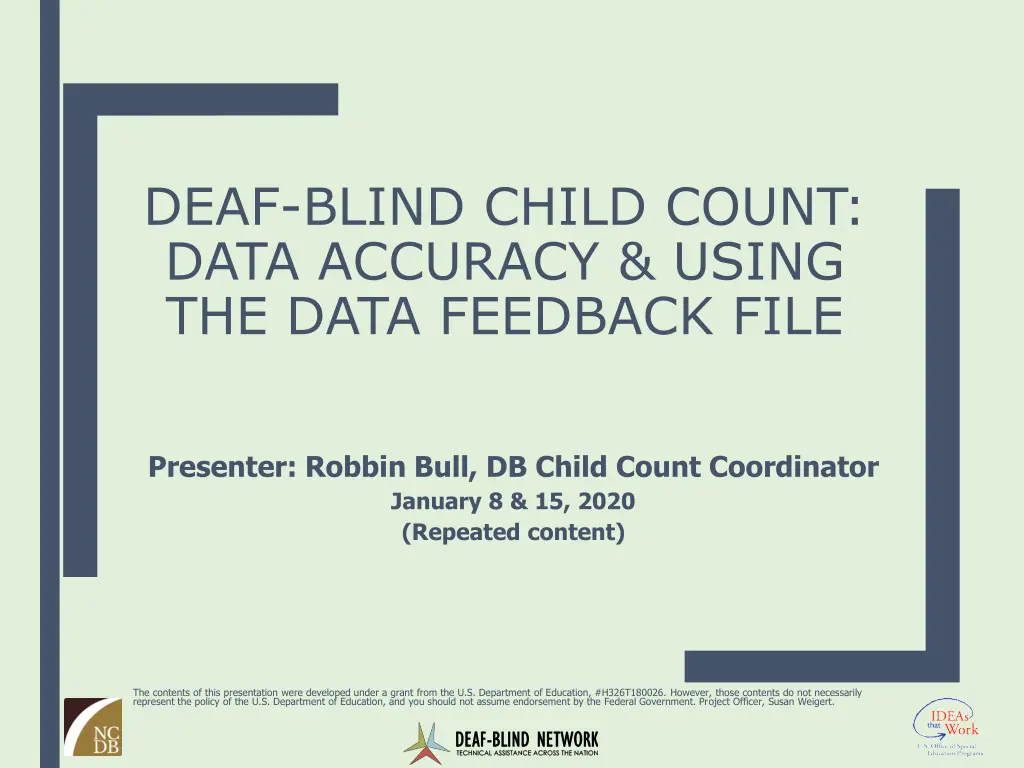
DEAF-BLIND CHILD COUNT: DATA ACCURACY & USING THE DATA FEEDBACK FILE Presenter: Robbin Bull, DB Child Count Coordinator January 8 & 15, 2020 (Repeated content) The contents of this presentation were developed under a grant from the U.S. Department of Education, #H326T180026. However, those contents do not necessarily represent the policy of the U.S. Department of Education, and you should not assume endorsement by the Federal Government. Project Officer, Susan Weigert.
Outcomes for Today Greater understanding of National child count reporting process Increase knowledge about data management best practices Improved strategies for cleaning DB child count data Increase confidence in working with state data records/files
What will not be covered: Detailed review of Deaf-Blind Child Count Reporting Process Refer to September 2019 Child Count Kick-Off presentation Find Annual Child Count Reporting Resources on website
Quick review of submission details Data can be collected in any spreadsheet or database program. Must be submitted as an Excel readable file (.xls, .csv, .xlsx) Data due May 5, 2020 Data MUST be submitted via the National Center website via the secure portal. Visit the Annual Resources for Reporting the Child Count web page for submission instructions. Include Data Notes with submission details helpful to understand your data trends
Data Notes Example 1: We added 28 new students. We had to remove 23 students who had aged-out, moved, died or were otherwise ineligible. I have a number of students who are not being reported for Part B funds (888). Most of these are due to parents who have refused services and withdrawn their children to "home-school" them with no special education/involvement from school. A few have graduated or received certificates but are still under 21. For the students that I removed, I wasn t sure what to put for one of them on the Part B exiting. I was told the student moved out of a particular district and I have been unable to locate their new placement, I put 6 Moved Known to be continuing. I wasn t sure if that was completely accurate, but I didn't know that they had "dropped out" either.
Data Note examples (cont.) Example 2: In our state we allow the 3 years olds to stay on IFSP until Aug. 31 of the year they turn 3, that is why many times they are still counted in Part C. Same thing for our children that turn 21---they can stay on the IEP until they graduate. Example 3: There was a decrease in the number of children 6 to 21 in educational setting of residential facility due to a data entry error that was discovered. The error was corrected in this year s submission.
Why are we doing this? We need confidence that the data means the same thing across the nation in order to direct TA and make decisions based on what the data are showing. Gives us: Ability to ask good questions Ability to interpret what the data mean Accurate data to answer the questions Ability to analyze data in meaningful ways Ability to decide on appropriate actions
Checking data for accuracy and completeness Investigate Missing Data Is it unknown or an error? Confirm Data Format and Ranges Are codes out dated? Were alpha used instead of numbers? Are data in wrong category for age of child? Check for Data Entry Errors Are there entries that don t belong? Was some data missed during entry? Determine where problem originated Data system and/or forms never updated? Mis-match form/data system? Export error?
Fields that cannot be blank Identification Code Child Number Birth Year Birth Month Birth Day Hearing Loss Vision Loss DB Project Exiting Part C Exiting Part B Exiting
Resources to have on hand Instructions and/or Quick Reference Code sheet Reference code values and labels DBCC Change Log Crosswalk of outdated values to newer values All can be found on the Annual Child Count Reporting Resources page.
Getting oriented to the Data Feedback File (DFF) Overview of Instructions Read through fully once Focus on Section 2 Review Heading Rows of Spreadsheet Different types of fields (data, calculation, flag)
What is file showing me? Review how flags work Colored rows Colored cells Colored text Header gives detail as well
Review Part C and Part B Change data with age transition Part C and Part B Codes EI and Ed Setting Codes Part C and Part B Exiting Codes Exiting data is important! IDEA exiting and DB Project exiting data determine if counted on national report
Ed Setting New Codes vs. Old Codes Reminder: We cross-walked any new codes to the old codes for national reporting purposes for 2018 and 2019 DFF checks against old codes, so if used new codes, may have some false flags Be familiar with what is on your forms, in your data system and spot check in your exported file
Filters are very helpful! Filter By specific values or color
Additional tips Hiding columns you do not need to look at during data checks can help view columns needing to be checked. SORTING data by age may be helpful. Sort by Birth Year, Birth Month, Birth Day to get the most accurate results.
Send data in for updated file Contact me if you want to send your data in for an updated feedback file Use submission portal for sending file for updated feedback file
Tools available to review data Annual Online Report - Filter your data - compare with National, get report of all individual state data in downloadable report Quick look at your state data, and quick charts and tables Allow you to download and generate state level reports Interactive Online Maps - Quickly look at your child count across years with pop up longitudinal graph, drill down by number or percent. Nice graphics for reports/presentations Percentage tables Longitudinal Data File - Hearing Loss by Vision Loss (2010-2017) Individual state tables and charts as well as national Generate trend reports, charts and graphs EI&R Self-Assessment Guide - Guide, but pre-populated data tables are also helpful. Compare your state against Part C proportions (Table 1) Compare your state against national DB proportions (Table 2) Compare your state against national DB age distribution (Table 3) Compare percent change between ages against national DB (Table 4) More details about using these tools are on our website.
DBCC Needs Assessment Workgroup 2006 was the last major review of data fields What revisions are necessary? What are desired? Workgroup recommendations will be presented to field for feedback
Im Here to Help! Don t hesitate to contact Robbin with questions.


")