Improving Education and Employment Outcomes for Disadvantaged Australian Youth
"Explore how The Smith Family, a national charity in Australia, is addressing educational challenges faced by disadvantaged youth through innovative programs like Learning for Life scholarship. Learn about their mission, impact, and key initiatives at different life stages to support youth in need."
Download Presentation

Please find below an Image/Link to download the presentation.
The content on the website is provided AS IS for your information and personal use only. It may not be sold, licensed, or shared on other websites without obtaining consent from the author. If you encounter any issues during the download, it is possible that the publisher has removed the file from their server.
You are allowed to download the files provided on this website for personal or commercial use, subject to the condition that they are used lawfully. All files are the property of their respective owners.
The content on the website is provided AS IS for your information and personal use only. It may not be sold, licensed, or shared on other websites without obtaining consent from the author.
E N D
Presentation Transcript
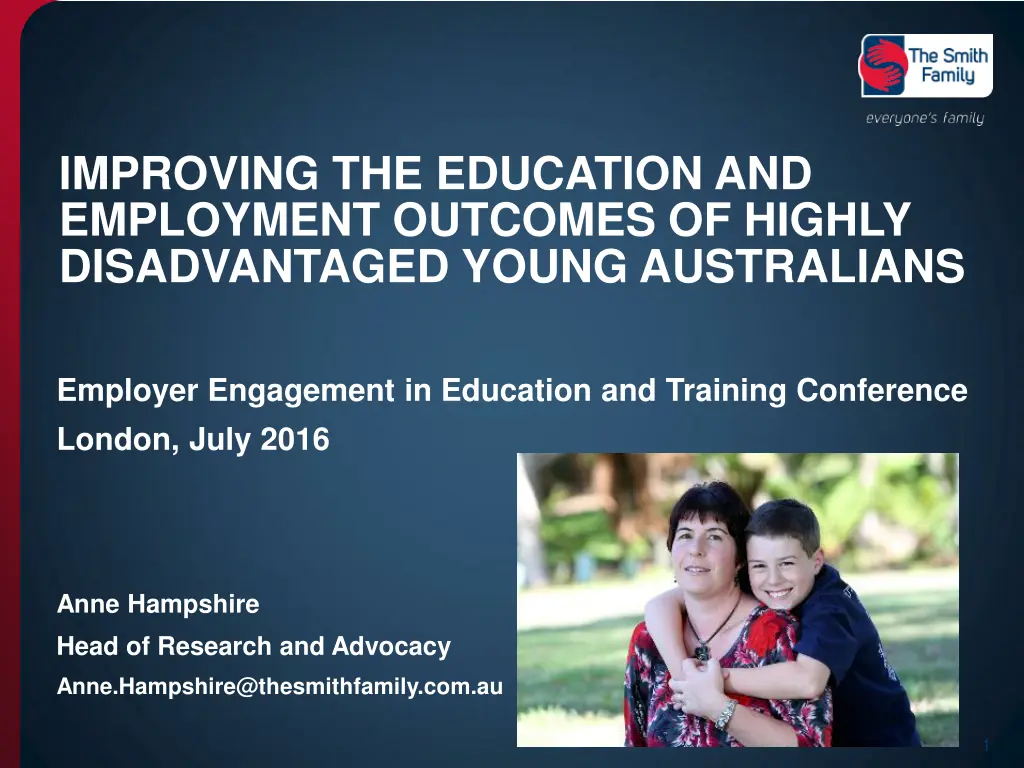
IMPROVING THE EDUCATION AND EMPLOYMENT OUTCOMES OF HIGHLY DISADVANTAGED YOUNG AUSTRALIANS Employer Engagement in Education and Training Conference London, July 2016 Anne Hampshire Head of Research and Advocacy Anne.Hampshire@thesmithfamily.com.au 1
The Smith Family STRUCTURE National, non-government charity, voluntary Board, 600+ staff VISION A better future for young Australians in need. HISTORY Established in 1922 by group of businessmen MISSION To create opportunities for young Australians in need by providing long-term support for their participation in education. SCALE Support 125,000 children, young people, parents/carers pa in 94 communities FINANCES $86.8 million in 2014-15 - $52.5 m from donations, corporate support and bequests - $22.6 m from government - $2.4 m from recycling commercial operation BELIEF Every child deserves a chance. 2
Australias educational challenge: Young people are behind at each stage EARLY YEARS PRIMARY YEARS SECONDARY YEARS POST-SCHOOL YEARS Developmentally vulnerable Numeracy Year 12 completion Post-school engagement 94% of Year 5 students with a parent who has a uni qualification are above the national minimum standard, compared to 61% of children whose parents did not complete Yr 12. Around 30% difference based on socioeconomic status of students. 41% of 24 year olds from most disadvantaged backgrounds were not fully engaged in work or study, compared to 17% among most advantaged. One in three children in most disadvantaged communities is developmentally vulnerable in one or more key areas when they start school. 3
LEARNING FOR LIFE PROGRAM 4
Learning for Life scholarship Relationship with a Learning for Life program coordinator Access to educational programs from early years to tertiary level + + Financial support Parent and community engagement 5
Key programs at different life stages EARLY YEARS PRIMARY YEARS SECONDARY YEARS POST-SCHOOL YEARS PARENTS AND CARERS Student2student reading program Learning Clubs iTrack career mentoring Creative enrichment Career and post- school pathways Work Inspiration Aboriginal girls programs Tertiary mentoring Financial Literacy Tech Packs Financial Literacy Let s Count Let s Read Balanced intervention across young person s life Learning for Life scholarship students can begin in the 1st year of school and continue through to the end of tertiary 6
Learning for Life key underpinnings Began almost 30 years ago Early intervention and long-term approach (Heckman) Parental engagement High expectations Reciprocity and accountability Beyond school complements but in addition to school Partnerships Outcomes focus 7
FAMILIES SUPPORTED BY LEARNING FOR LIFE 8
Learning for Life families 34,000 students nationally; 18,000 families; 94 communities All low income families Health Care Card or pension 18% of Indigenous background Over half are single parent, 6% grandparent/kinship/foster 40% of students and 50% of parents have a health or disability issue 71% of parents not in the labour force or unemployed; 60% haven t completed high school 20% of students have been at 4 or more schools and 1 in 20 have been at 6 or more schools More disadvantaged than their peers in disadvantaged schools 50%+ of secondary and tertiary students on program for 6+ years 9
LEARNING FOR LIFE THROUGH HIGH SCHOOL 10
Learning for Life through high school Increased focus on helping LfL students (and families) to understand and plan for study, career and post-school options Short term programs include: - Learning Clubs - I-track career mentoring - Work Inspiration - Experiential career and uni visit days - Creative enrichment Networks, mentoring, new knowledge and skills, possibilities, goal setting, self-confidence and self-efficacy, work exposure and experience 11
I-track On-line mentoring program for students in Years 9 to 11 Students matched with supportive adult (half from our corporate partners), who provides advice and guidance about workplace, study and career opportunities and planning for them Weekly chat sessions for an hour over 18 weeks with trained mentors Aims to increase confidence, aspirations and knowledge re post- school transition 12
i-track outcomes, 2015(pre and post) Significant increase in % more motivated re school, going to study post-school, knew what school subjects they needed, career they wanted, where to get information re careers, steps to take Significant reduction in % who were not sure what they would do when they left school More than 3 in 4 students increased their confidence to ask for advice/help from adults She would always encourage me to do well. She would motivate me on never giving up even at the hardest of times because every no leads me closer to a yes she was really inspirational. He helped me with my career options and what I might be interested in. He told me about his career and what he did to reach where he is. He motivated me to do well in my education and we have many things in common. My mentor is the best. 13
OUTCOMES OF LFL STUDENTS 14
Measures of effectiveness ENGAGEMENT ADVANCEMENT ATTENDANCE Young people are in education, training, and/or work Young people complete Yr 12 or equivalent Young people stay engaged with learning LONGER- TERM OUTCOMES Improved literacy and numeracy Improved confidence (self-efficacy) Improved motivation and aspiration Enhanced networks and relationships Improved knowledge/understanding Improved or sustained school attendance SHORT-TERM OUTCOMES Longitudinal dataset, unique student ID, admin, demographic and outcomes PROGRAMS Build skills & knowledge & influence attitudes & behaviours Let s Count, Let s Read, Learning for Life, Student2Student, iTrack mentoring, Learning Clubs, Creative enrichment, careers/post- school options workshops, Work Inspiration, Tertiary Mentoring, Tech Packs, Financial literacy 15
Improved school completion The Smith Family s advancement rate Learning for Life students who were in Year 10 in 2013 and advanced to Year 12 or its equivalent by 2015. Up from 60% for the period 2010 12. 68.2% 6,500 students across Australia have been supported on Learning for Life to complete Year 12 between 2012 and 2015. National comparison The national Year 12 completion rate for 19 year olds from Australia s lowest socioeconomic decile is 60.6% and for the second lowest decile is 61.4%. This is well below The Smith Family s Advancement Rate of 68.2%. 16
Successful post school transitions 84.2% of former Learning for Life students are in work or study 12 months after leaving the program Fully engaged Partly engaged 65.8% 18.4% For Indigenous young people, 74.2% were engaged 54.6% were fully engaged and 19.6% were partially engaged. For both Indigenous and non-Indigenous former students who were not engaged, 80% were actively seeking employment and one in six was volunteering. These rates are significantly above national outcomes for similar young people. 17
SOME OF WHAT WERE LEARNING 18
Engagement rate Parental education Parental education has little influence on post-school engagement rate of LfL students except if parent has a degree. 19
Engagement rate by highest level of school completed Stronger engagement if completed Yr 12. Seemingly little difference between Yr 10 and Yr 11 leavers, however 20
Continuing study by highest level of school completed Stronger likelihood of continuing study if completed Yr 12. Young people completing Yr 10 much more likely to continue studying than those completing Yr 11 likely better longer- term outcomes Policy & program gap in Yr 11 opportunity to improve our program suite and influence public policy 21
Early school leavers Reasons for leaving early multiple and complex Years 9-11 Many related directly to ongoing challenging financial circumstances Desire or need for financial independence Earn own money Get a job, apprenticeship or traineeship Years 9 and 10 Range of school related factors also strongly linked to leaving school early Problems with students and/or teachers Missed a lot of school Dislike school Not doing well at school Opportunities for early intervention by The Smith Family 22
Other findings Significant proportions (20%+) of those who d left school early were sorry they d made that decision Strong high school attendance rates in Year 8 positively associated with completing school Stronger achievement rates in English in Year 10 positively associated with completing school 23
HOW ARE WE USING WHAT WE RE LEARNING? 24
Using data to improve outcomes Data, evaluation and research are driving program refinements and continuous improvement, for eg: More tailored support for particular groups of students and at particular times (eg those struggling with school attendance, transitioning to high school, Aboriginal and Torres Strait Islander background students) Changes to frequency and nature of engagement with families Re-defining roles of staff, role specialisation Greater focus on supporting students to complete Year 12 Training for LfL staff on working with highly disadvantaged families Refined induction program for new staff 25
Learning for Life: Good progressjourney continues Evidenced-informed program which has evolved over 30 years Early intervention, long-term approach, responsive to changing needs Highly targeted Reciprocity, parental engagement, high expectations Improving educational and employment outcomes of highly disadvantaged young Australians, with further improvements possible not all young people on the program are achieving Cost effective, involving multiple partnerships and volunteers Ongoing analysis of longitudinal data will further enhance evidence base 26
QUESTIONS Further information is available at www.thesmithfamily.com.au, including a research report on the LfL program Anne.Hampshire@thesmithfamily.com.au 27

