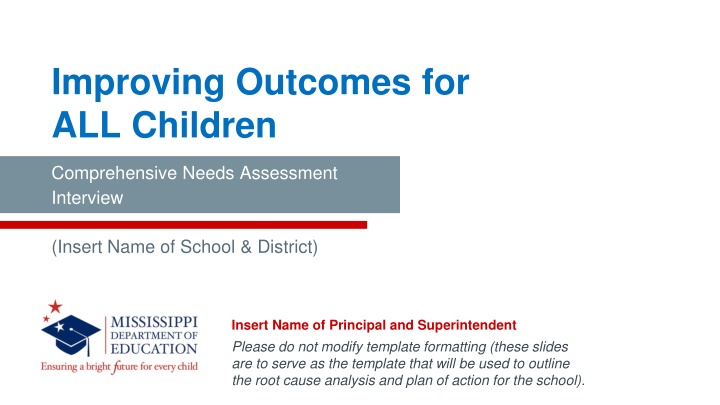
Improving Outcomes for All Children: Needs Assessment
This presentation outlines a comprehensive needs assessment interview for improving outcomes for all children in a school district. It covers strategic goals, school vision and mission, attendance trends, staffing data, and student achievement data analysis.

Download Presentation

Please find below an Image/Link to download the presentation.
The content on the website is provided AS IS for your information and personal use only. It may not be sold, licensed, or shared on other websites without obtaining consent from the author.If you encounter any issues during the download, it is possible that the publisher has removed the file from their server.
You are allowed to download the files provided on this website for personal or commercial use, subject to the condition that they are used lawfully. All files are the property of their respective owners.
The content on the website is provided AS IS for your information and personal use only. It may not be sold, licensed, or shared on other websites without obtaining consent from the author.
E N D
Presentation Transcript
Improving Outcomes for ALL Children Comprehensive Needs Assessment Interview (Insert Name of School & District) Insert Name of Principal and Superintendent Please do not modify template formatting (these slides are to serve as the template that will be used to outline the root cause analysis and plan of action for the school).
MISSISSIPPI STATE BOARD OF EDUCATION STRATEGIC PLAN GOALS 4 5 6 3 1 2 Every Community Effectively Uses a World-Class Data System to Improve Student Outcomes Every Student Graduates from High School and is Ready for College and Career All Every Child Has Access to a High- Quality Early Childhood Program Students Proficient and Showing Growth in All Assessed Areas Every School Has Effective Teachers and Leaders Every School and District is Rated C or Higher
Name of District School s Vision School s Mission School s Goals (1 Slide) 3
School Snapshot Attendance Data Trend 2016-17 2017-18 2018-19 2019-20 (current) Average Daily Attendance (ADA) Teacher Attendance Rate Chronic Absenteeism Rate Enrollment Grade Configuration of School (1 Slide) 4
School Snapshot Briefly address the school s strategy/response to address the attendance data trends provided in the chart and the next steps to address Chronic Absenteeism in the school. Student ADA and Chronic Absenteeism: Teacher Attendance: (1 Slide) 5
School Snapshot AREA 2016-17 2017-18 2018-19 2019-20 Number of Certified Teachers Number of Limited Service Teachers Number of Administrators Teacher Turnover Rate (percent) TBD Percent of Teachers rated 3 TBD Accountability Rating & Score (1 Slide) 6
School Snapshot Briefly address the school s strategy/response to the staffing data trends provided in the chart on the previous slide. Recruitment Retention (1 Slide) 7
School Snapshot (MAAP) Kindergarten 8th Grade Subject Area 2016-17 2017-18 2018-19 ELA Proficiency Math Proficiency Science Proficiency 3rd Grade ELA Pass Rate K-Readiness Post Assessment (1 Slide) 8
School Snapshot (MAAP) Subject Area 2016-17 2017-18 2018-19 ELA Proficiency Algebra I Proficiency Biology I Proficiency U.S. History Proficiency Graduation Rate Subject Area 2016-17 2017-18 2018-19 Retesters (Percent/Number) ELA Algebra I Biology I U.S. History (1 Slide) 9
Graduation Rate vs. Proficiency After a review of proficiency rates and graduation rate for the school, please address the correlation between the two for your school. 10
Summary of Evidence-based Strategy Implementation Briefly address the evidence-base and research behind the specific strategies that were used in the prior 3 years to address identified needs and the results. What Evidence-based strategies were utilized? How did outcomes demonstrate provision of equitable practices to support improved outcomes for all groups of learners? Briefly address the next steps based on the data analysis. (2 Slides) 11
Data Analysis Key Finding: STRENGTHS Describe the top strengths in your School/District that were uncovered through deep examination of the following areas: (Please Bullet) Use of Instructional Resources/Materials (Curriculums Used Across the System for Literacy, Math, Science and History) Student Performance (Academic Achievement, Acceleration, CCR, Grad Rate, etc.) and closing gaps based on disaggregation of student achievement data. Multi-tiered System of Support Implementation (Quality Tier I Instruction, Early Warning Indicators addressing attendance, behavior and course performance, and Interventions) Fiscal and Human Resources (4 Slides) 12
Data Analysis Key Finding: GAPS Describe the most critical gaps identified by your school that were uncovered through deep examination of the following areas: (Please Bullet) Use of Instructional Resources/Materials (Curriculums Used Across the System for Literacy, Math, Science and History) Student Performance (Academic Achievement, Acceleration, CCR, Grad Rate, etc.) and closing gaps based on disaggregation of student achievement data. Multi-tiered System of Support Implementation (Quality Tier I Instruction, Early Warning Indicators addressing attendance, behavior and course performance, and Interventions) Fiscal and Human Resources (4 Slides) 13
Summary of 1st Quarter Benchmark/Interim Performance Identify the Interim/Benchmark Assessment being utilized. Name of Interim/Benchmark Assessment: How often is the assessment administered? ELA ELA Growth Math Proficiency Math Growth Science Proficienc y U.S. History Proficiency 2019-20 Baseline 2019-20 Current (1 Slide) 14
Summary of Key Findings Describe how the findings from this analysis will inform the school's actions in the provision of equitable access to a quality instructional program for ALL student sub- groups in your school (effective teachers, instructional practices, professional learning, and the utilization of supplemental funding). Describe how the district is addressing the academic outcomes of the lowest performing subgroups in the school. (1 Slide) 15
Action Plan for Improving Student Outcomes Address specific next steps based on the data analysis in the table provided. (Please address a minimum of 1 strategy per domain) Domain Priority Strategy Expected Outcome Position Responsible Next Steps Timeframe Transformational Leadership Instructional Transformation (Instruction and Assessment) Talent Development Cultural Shift (Equity, Culturally Responsive Teaching, Parent and Community Engagement) (2 Slides) 16
Resource Analysis: Budget Complete the table below. Source Per Pupil Amount Use/Activity Anticipated Outcome District Title I IDEA School Improvement Total (1 Slide) 17
Resource Analysis: District Supports Does the school currently have external providers that support the instructional practices of the school? If yes, identify those providers, their scope of work, the frequency of services, the number of years used between 2016-17 and 2019-20, and the process used to measure provider efficacy (Complete the Chart Below) External Provider (Consultant Group) Area of Frequency of Support Performance Outcome (Proficiency)/(Growth) Cost Support/Expected Outcome 2019-20 2018-19 2017-18 2016-17 (1 Slide) 18
Resource Analysis: District Supports Does the district currently have partnerships with regional educational service agencies (i.e. RESA) or other educational service groups? If yes, identify those providers, their scope of work, the frequency of services, the number of years used between 2016-17 and 2019-20, and the process used to measure provider efficacy. (Complete the Chart Below) RESA(s) Area of Frequency of Support Performance Outcome (Proficiency)/(Growth) Cost (PREPS, SRESA, GCEIC, RCU) Support/Expected Outcome 2019-20 2018-19 2017-18 2016-17 (1 Slide) 19
Resource Analysis: District Supports Briefly describe the return on investment in terms of improved student performance based on the analysis of external provider and regional educational service agency supports provided to the school. (1 Slide) 20
Resource Analysis: District Supports Briefly describe the type of support the district provide to the school to improve performance outcomes during the 2019-20 school year? (1 Slide) 21
Planning for Long-Term Sustainability What are your strategies to sustain improvement efforts created through your plan? Which MDE Resources have you utilized to support your work? Which MDE Resources did you find the most helpful and impactful? What is the most feasible and effective way that the MDE can support you with the gaps identified through this root cause analysis? (1 Slide) 22
Questions from State Team (List the name and title of each school and district team member who is present at the interview so that clarifying questions may be directed to specific individuals) 23


 Kindergarten – 8th Grade")
")