Improving Patient Access in Neuro-Interventional Ultrasound
Addressing the challenges faced in providing neuro-interventional ultrasound services by collaborating with various departments, the project aims to decrease delays, increase access, and streamline patient care. Through a comprehensive analysis of scheduling issues and personnel causes, the goal is to enhance efficiency and patient outcomes within the healthcare system.

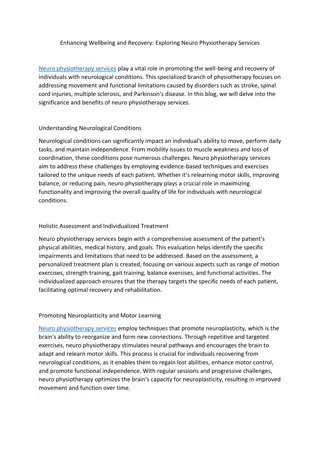
Download Presentation

Please find below an Image/Link to download the presentation.
The content on the website is provided AS IS for your information and personal use only. It may not be sold, licensed, or shared on other websites without obtaining consent from the author. If you encounter any issues during the download, it is possible that the publisher has removed the file from their server.
You are allowed to download the files provided on this website for personal or commercial use, subject to the condition that they are used lawfully. All files are the property of their respective owners.
The content on the website is provided AS IS for your information and personal use only. It may not be sold, licensed, or shared on other websites without obtaining consent from the author.
E N D
Presentation Transcript
Streamlining Patient Access NEURO NEURO- -INTERVENTIONAL INTERVENTIONAL ULTRASOUND ULTRASOUND IBI IBI OPUIYO,RDMS OPUIYO,RDMS JOSEPH STEELE STEELE,MD EXECUTIVE SPONSOR EXECUTIVE SPONSOR - - JOSEPH ,MD
The project was a collaboration with ICCE, OPI, NIR Ultrasound technologists, nurses and faculty
Neuro-Interventional Ultrasound Provide ultrasounds of the thyroid and neck regions Referrals from various clinics throughout the institution including Endocrine, Melanoma, Head and Neck Surgery, and Lymphoma services Number of completed patient exams in NIR US has grown in 5 year period from just over 4,000 in FY06 to 10,000 exams and biopsies in FY11
PROBLEM PROBLEM
Who Is Impacted ? Head and Neck Surgery Endocrine Thoracic NIR Other Referring Services Melanoma PATIENTS
NIR US Project Goal Decrease Delays Increase Access
NIR will decrease the number of days for referring clinics to obtain diagnostic scans for AIM patients from 25 or more working days to less than 5 days by June 2011.
IDENTIFYING & ASSESSING CAUSE ANALYSIS CAUSE ANALYSIS
Scheduling Environment Procedures CLINIC HOURS OF OPERATION 8-4PM Nursing documentation take time Limited slots for clinics 6SCAN ROOMS,TECHS Multiple BXs @ once Congestionof appts. CertainUS rooms are only used for scanning Wait for requesting MD to reply Allotted exam times: SCANS:1HOUR BX: 2 HOURS PATIENT SCHEDULING Floor Plan Issue: Waitingarea, holding area, and US rooms are far apart Waitfor BX result and DIA to set up Limited Patient Access to NIR Diagnostic Scans and Procedures WORKFLOW Dictation between patients Checkin early and want to be seen early TEMPLATE Conferences and meetings Arrivelate (weather, traffic and other appts . Adding patients without verifying current schedule No show Lost in the hospital Double duties Anxietyinduce HTN Patients PERSONNEL CAUSE ANALYSIS
KEY ISSUES KEY ISSUES SCHEDULING LIMITATIONS OPERATIONS PROCESSES WORKFLOW
PERFORMANCE ASSESSED BASELINE DATA BASELINE DATA
Capacity Backlog : Scheduling Max 38 potential appointment slots/day 25 day delay for next available appointment
Process Analysis: Scheduling Issue: limited appointment slots available
Operations: Processes Workflow Personnel Situational Processes Practical Processes
Operations: Asset Utilization PRE TEMPLATE ROOM UTILIZATION HIGH VOLUME DATES NUMBER OF PROCEDURES BEGIN TO LEAVE DEPT. 1/21/2011 1/24/2011 1/27/2011 1/31/2011 2/7/2011 2/9/2011 2/11/2011 2/15/2011 2/25/2011 2/28/2011 3/2/2011 3/4/2011 3/8/2011 3/9/2011 3/16/2011 3/23/2011 3/28/2011 3/29/2011 3/30/2011 4/1/2011 4/5/2011 49 44 44 52 44 50 46 47 48 49 49 45 47 54 75.41 55.37 68.72 66.6 43.7 60.92 71.43 57.67 75.37 65.71 66.58 74.96 49.02 64.81 57.49 56.17 45.86 62.59 58.91 52.69 55.11 46 48 46 53 49 44 45 AVERAGE TIME IN MINUTES 47.57 61.19 Pre Template Room utilization 80 Average time in Rooms 70 60 50 40 30 20 10 0 40564 40567 40570 40574 40581 40583 40585 High Volume Dates 40589 40599 40602 40604 40606 40610 40611 40618 40625 40630 40631 40632 40634 40638
PHASED APPROACH INTERVENTIONS INTERVENTIONS
Phase I Feb 1, 2011 to March 10, 2011 SCHEDULE Management team began complete restructuring of scheduling template Opening of initial set of additional scheduling slots for servicing clinics. This addressed immediate bottleneck issues. OPERATIONS Personnel changes to accommodate expanded schedule. 1. New technologist schedule 2. New temporary Imaging Assistant
Phase II March 11, 2011 to April 14, 2011 SCHEDULE Process changed for ordering diagnostic scans/biopsies Communications and education of referring service Clinical Coordinators on forthcoming schedule template usage OPERATIONS Departmental operational hours expanded
Phase III April 15,2011 to July 15, 2011 Go Live: opening of restructured scheduling template Data gathered for 90 day assessment of combined changes
Results The success of the project was measured using two metrics The number of available daily slots for procedures or scans. The time to next appointment for a diagnostic ultrasound and biopsy
The data reveals that measured improvements are attributed to : SCHEDULE The new scheduling template
Available appointment slots increased from 38 to 55 NIR Clinical Operations Report Summary Template Timeslots Available Jan. Feb. March April May June July Scan w/biopsy timeslots 10 10 10 14 16 16 16 Scan only timeslots 18 18 23 24 25 25 25 Overbook timeslots 10 10 10 12 14 14 14 Total Timeslots 38 38 43 50 55 55 55
Results Scheduling Template Scheduling Template NUMBER OF WORKDAYS FOR NEXT AVAILABLE APPOINTMENT 80 70 60 # WORKDAYS 50 40 Scan/Biopsy Overbook Scan/Biopsy Template 30 Scan Only Overbook Scan Only Template 20 10 0 WORK WEEK
The data reveals that measured improvements are attributed to : OPERATIONS Pre assessments Extended department hours of operation Change in personnel (tech/MD) schedules Additional Imaging Assistant (personnel changes) New lead technologist role
AVERAGE TIME IN MINUTES: Pre Template Post Template 61.19 minutes 54.63 minutes Room utilization improved. The time to perform one complete procedure (time from patient entering the room to exiting the room) decreased 6.6 minutes. 90 Day NIR Room Utilization Times 80 Room Usage Per Patient 70 60 Seen in Minutes Pre Template Room Utilization Times Jan 2011- Apr 2011 Post Template Room Utilization Times Apr 2011- July 2011 50 40 30 20 10 0 90 Day Period
Calculation Summary / ROI Year 0 Year 1 Year 2 Year 3 Cost of Capital Investments/Costs Benefit/Revenue Annual Net Benefit/Revenue(Costs) 9.20% (3,906) 0 0 0 120,919 120,919 120,919 120,919 120,919 120,919 (3,906) Benefit/Revenue Including Soft Savings Annual Net Benefit (Costs) Including soft Savings 120,919 120,919 120,919 (3,906) 120,919 120,919 120,919 Risk Adjusted ROI = Net Present Value of Cumulative Net Benefit / Net Present Value of Total Costs RA ROI (Margin for yrs 1-3 discounted @ Cost of Capital %) Net Present Value Internal Rate of Return (Expected Return) 6959% $275,722.78 3096%
NEXT STEPS NEXT STEPS
Thank You NIR US Process Improvement Teams NIR US Manager Tonya Brightmon Executive Sponsor Dr. Steele