Improving Service Quality through Data-Driven Decisions
Addressing a critical challenge, this case study delves into the QI work undertaken by a dedicated team. By utilizing data measurement, process mapping, and prioritization, the team identified change opportunities, leading to significant outcomes. Key learnings and recommendations highlight the impact on decision-making processes and the subsequent improvements in service delivery.

Download Presentation

Please find below an Image/Link to download the presentation.
The content on the website is provided AS IS for your information and personal use only. It may not be sold, licensed, or shared on other websites without obtaining consent from the author.If you encounter any issues during the download, it is possible that the publisher has removed the file from their server.
You are allowed to download the files provided on this website for personal or commercial use, subject to the condition that they are used lawfully. All files are the property of their respective owners.
The content on the website is provided AS IS for your information and personal use only. It may not be sold, licensed, or shared on other websites without obtaining consent from the author.
E N D
Presentation Transcript
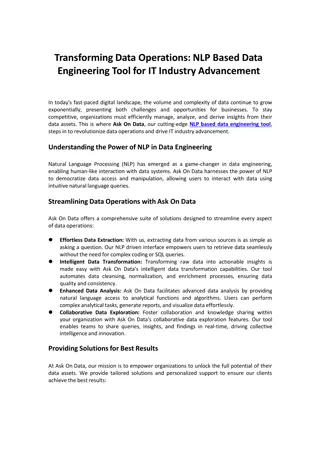
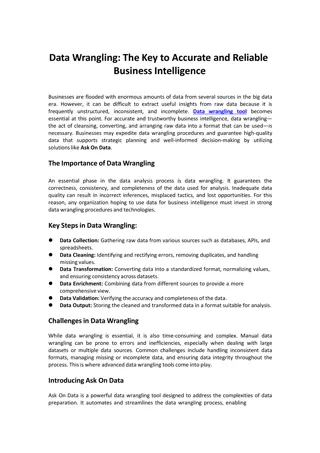
Space for your logo top right Space for partnership logos top left Title heading What was this project? Title sub heading descriptive (perhaps name the service/team the case study is about) Date of the work Key point use the house style/branding of your board throughout the case study. Your communications team should be able to help This initial slide should provide the context of the QI work that was undertaken and the challenge the team faced and wished to (consider including dates and key information regarding the service/speciality) Key quote that illustrates the strength of the work and the outcome
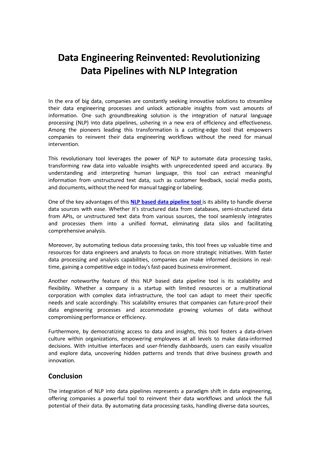
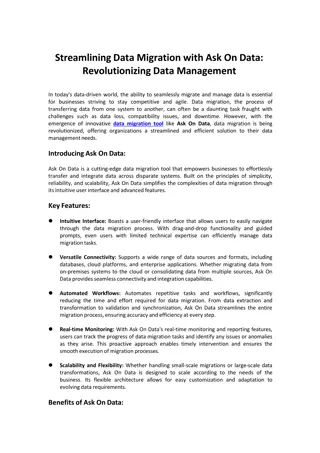
Background Photo/screenshot What was the situation for the service prior to the QI project? Process/method How did they identify the test of change/change opportunity? For example - did they use process mapping, discussions at a team meeting? Key quote about the challenge or the process/method Prioritisation how did they plan to do each thing in which order? Key learning point For example - what did the team do that made their decision-making process around identifying the change opportunities easier?
Data/measurement Where possible it is good practice to show some data regarding the change seen from the work . This could include an annotated run chart or SPC Insert image of a chart/graph Highlight key points of interest Highlight key points of interest Key learning point What did the data do to help enable decisions?
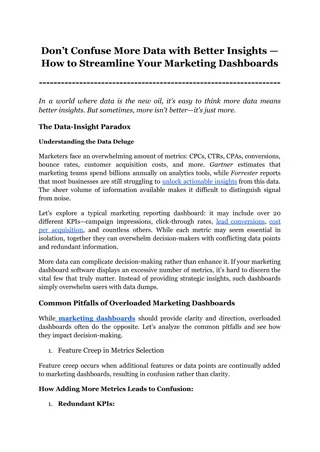
Key learning and recommendations Key outcome Key outcome What key learning and recommendations is the team taking forward from this work? Tassitat ullabo. Berspictur, core ni doluptatios aut magnihil et acculla quodis consecae derferem qui andias con nonseceped et explita adi dis rerum riscidella dolumqui reius uta quia nonsequi Tassitat ullabo. Berspictur, core ni doluptatios aut magnihil et acculla quodis consecae derferem qui andias con nonseceped et explita adi dis rerum riscidella dolumqui reius uta quia nonsequi Key outcome Key outcome Key quote of the difference the work has made Tassitat ullabo. Berspictur, core ni doluptatios aut magnihil et acculla quodis consecae derferem qui andias con nonseceped et explita adi dis rerum riscidella dolumqui reius uta quia nonsequi Tassitat ullabo. Berspictur, core ni doluptatios aut magnihil et acculla quodis consecae derferem qui andias con nonseceped et explita adi dis rerum riscidella dolumqui reius uta quia nonsequi Source What next? Include details of the next steps or updates from the team
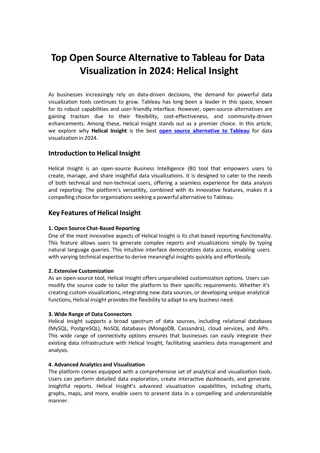
Example Icons Tip: pick and choose from this collection of transparent icon graphics to help illustrate key points in your presentation