Improving Warehouse Inventory Accuracy
The warehouse inventory accuracy rate is currently at 75%, leading to frequent stockouts and overstock situations affecting customer satisfaction and operational costs. Discover how the team identified root causes, implemented countermeasures, and achieved significant results in just three months.

Download Presentation

Please find below an Image/Link to download the presentation.
The content on the website is provided AS IS for your information and personal use only. It may not be sold, licensed, or shared on other websites without obtaining consent from the author.If you encounter any issues during the download, it is possible that the publisher has removed the file from their server.
You are allowed to download the files provided on this website for personal or commercial use, subject to the condition that they are used lawfully. All files are the property of their respective owners.
The content on the website is provided AS IS for your information and personal use only. It may not be sold, licensed, or shared on other websites without obtaining consent from the author.
E N D
Presentation Transcript
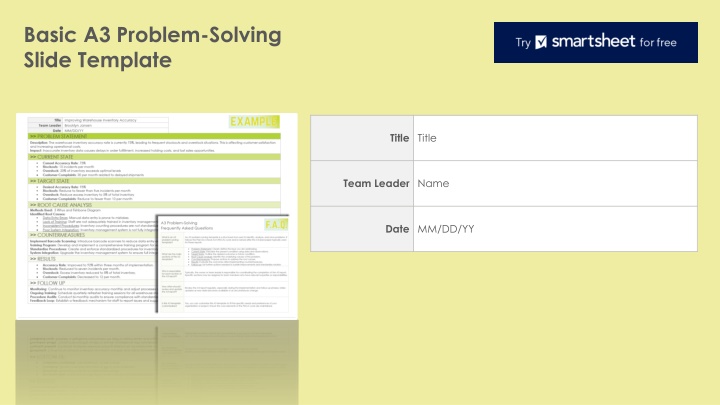
Basic A3 Problem-Solving Slide Template A blue and white sign Description automatically generated Title Title Team Leader Name Date MM/DD/YY
>> PROBLEM STATEMENT >> CURRENT STATE >> TARGET STATE >> ROOT CAUSE ANALYSIS >> COUNTERMEASURES >> RESULTS >> FOLLOW UP
Title Improving Warehouse Inventory Accuracy Team Leader Brooklyn Jansen Date MM/DD/YY >> PROBLEM STATEMENT Description: The warehouse inventory accuracy rate is currently 75%, leading to frequent stockouts and overstock situations. This is affecting customer satisfaction and increasing operational costs. Impact: Inaccurate inventory data causes delays in order fulfillment, increased holding costs, and lost sales opportunities. >> CURRENT STATE Current Accuracy Rate: 75% Stockouts: 15 incidents per month Overstock: 20% of inventory exceeds optimal levels Customer Complaints: 30 per month related to delayed shipments >> TARGET STATE Desired Accuracy Rate: 95% Stockouts: Reduce to fewer than five incidents per month Overstock: Reduce excess inventory to 5% of total inventory Customer Complaints: Reduce to fewer than 10 per month >> ROOT CAUSE ANALYSIS Methods Used: 5 Whys and Fishbone Diagram Identified Root Causes: Data Entry Errors: Manual data entry is prone to mistakes. Lack of Training: Staff are not adequately trained in inventory management systems. Inconsistent Procedures: Inventory counting procedures are not standardized. Poor System Integration: Inventory management system is not fully integrated with the ordering system. >> COUNTERMEASURES Implement Barcode Scanning: Introduce barcode scanners to reduce data entry errors. Training Program: Develop and implement a comprehensive training program for warehouse staff on inventory management systems. Standardize Procedures: Create and enforce standardized procedures for inventory counting. System Integration: Upgrade the inventory management system to ensure full integration with the ordering system. >> RESULTS Accuracy Rate: Improved to 92% within three months of implementation. Stockouts: Reduced to seven incidents per month. Overstock: Excess inventory reduced to 8% of total inventory. Customer Complaints: Decreased to 12 per month. >> FOLLOW UP Monitoring: Continue to monitor inventory accuracy monthly and adjust processes as needed. Ongoing Training: Schedule quarterly refresher training sessions for all warehouse staff. Procedure Audits: Conduct bi-monthly audits to ensure compliance with standardized procedures. Feedback Loop: Establish a feedback mechanism for staff to report issues and suggest improvements.
A3 Problem-Solving Frequently Asked Questions What is an A3 problem- solving template? An A3 problem-solving template is a structured tool used to identify, analyze, and solve problems. It follows the Plan-Do-Check- Act (PDCA) cycle and is named after the A3-sized paper typically used for these reports. Problem Statement: Clearly define the issue you are addressing. Current State: Describe the present condition using data and observations. Target State: Outline the desired outcome or future condition. Root Cause Analysis: Identify the underlying causes of the problem. Countermeasures: Propose actions to address the root causes. Results: Evaluate the outcomes after implementing countermeasures. Follow-up: List further actions needed to sustain improvements and standardize solution What are the main sections of this A3 template? Who is responsible for each section of the A3 report? Typically, the owner or team leader is responsible for coordinating the completion of the A3 report. Specific sections may be assigned to team members who have relevant expertise or responsibilities. How often should I review and update the A3 report? Review the A3 report regularly, especially during the implementation and follow-up phases. Make updates as new data becomes available or as circumstances change. Is this A3 template customizable? Yes, you can customize this A3 template to fit the specific needs and preferences of your organization or project. Ensure the core elements of the PDCA cycle are maintained.
DISCLAIMER Any articles, templates, or information provided by Smartsheet on the website are for reference only. While we strive to keep the information up to date and correct, we make no representations or warranties of any kind, express or implied, about the completeness, accuracy, reliability, suitability, or availability with respect to the website or the information, articles, templates, or related graphics contained on the website. Any reliance you place on such information is therefore strictly at your own risk.