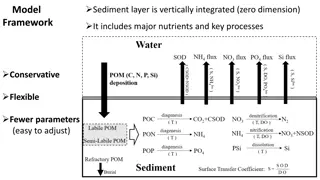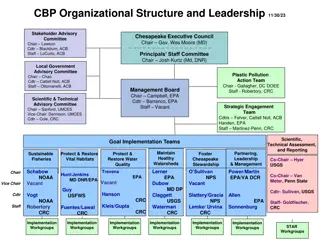
Improving Watershed Management: Achievements and Impact
Explore the significant impact of 30 watershed organizations in the Chesapeake Bay region, including mobilizing participants, advocacy initiatives, and management improvements. Learn about the outcomes, support received, and benefits to waterways.

Download Presentation

Please find below an Image/Link to download the presentation.
The content on the website is provided AS IS for your information and personal use only. It may not be sold, licensed, or shared on other websites without obtaining consent from the author. If you encounter any issues during the download, it is possible that the publisher has removed the file from their server.
You are allowed to download the files provided on this website for personal or commercial use, subject to the condition that they are used lawfully. All files are the property of their respective owners.
The content on the website is provided AS IS for your information and personal use only. It may not be sold, licensed, or shared on other websites without obtaining consent from the author.
E N D
Presentation Transcript
Watershed Organizations Benefit the Bay 2014 Results of the River Network Survey of 30 Watershed Groups in the Chesapeake Bay
Out of 17.7M inhabitants of the Bay Region, these 30 org's mobilized ... 1.0% 0.8% 105,382 participants thru schools 0.6% 49,417 in events 0.4% 34,602 took action 16,022 donated 0.2% 0.0% Adults & Children thru Schools % Participated in Events or Activities % Constituents Acted on an Issue on Behalf of Your Org % Donated
The percentage of Chesapeake Bay inhabitants who were Out of 17.7M inhabitants of the Bay Region, these 30 org's mobilized ... reached. 1.0% 0.8% 105,382 participants thru schools 0.6% 49,417 in events 0.4% 34,602 took action 16,022 donated 0.2% 0.0% Adults & Children thru Schools % Participated in Events or Activities % Constituents Acted on an Issue on Behalf of Your Org % Donated
These 30 org's were supported by ... 30,000 24595 25,000 20,000 16022 15,000 10,000 5563 5,000 887 0 Members Donors Volunteer Participants Volunteer Leaders
Participation with and without strategic plan 500 450 400 350 300 250 200 150 without strategic plan 100 50 with strategic plan -
These 30 Organizations Improved Watershed Management 140 120 100 80 60 40 20 - Policy Initiatives Led Policy Initiatives Succeeded Enforcement Actions Initiated Watershed Plans Created or Implemented
... and Benefitted Waterways Logarithmic scale. 1,000,000 671,592 100,000 52,779 42,747 6,950 10,000 1,000 100 10 1 Sites Monitored Acres of Land Use Improved Feet of Stream Restored Pounds of Trash Removed
Average Advocacy Initiatives for Organizations 2.00 1.80 1.60 1.40 1.20 1.00 0.80 0.60 Without stratregic plan 0.40 0.20 With strategic plan -