Income Disparities and Social Mobility Trends in the USA and Sweden
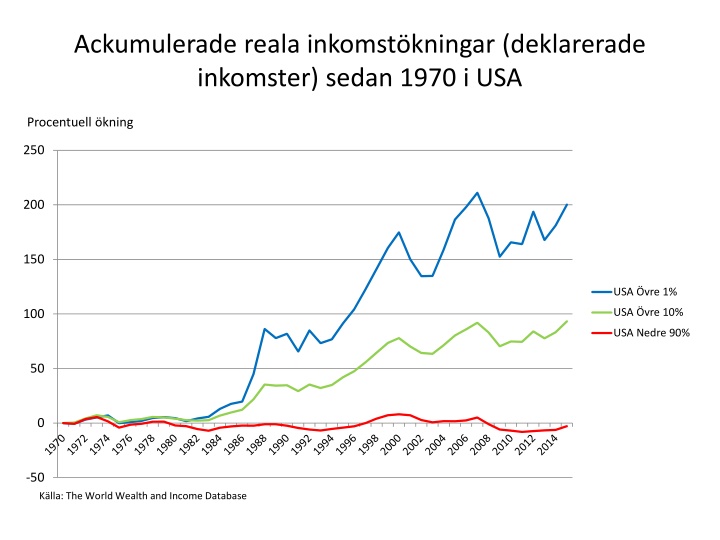
The visual data depicts the accumulation of real declared incomes since 1970 in the USA and Sweden, showcasing the disparities in income growth between different percentiles. Additionally, it delves into intergenerational mobility versus inequality, highlighting the mobility trends and income elasticity of various countries. The Gini coefficient is also compared for a better understanding of income inequality.

Download Presentation

Please find below an Image/Link to download the presentation.
The content on the website is provided AS IS for your information and personal use only. It may not be sold, licensed, or shared on other websites without obtaining consent from the author.If you encounter any issues during the download, it is possible that the publisher has removed the file from their server.
You are allowed to download the files provided on this website for personal or commercial use, subject to the condition that they are used lawfully. All files are the property of their respective owners.
The content on the website is provided AS IS for your information and personal use only. It may not be sold, licensed, or shared on other websites without obtaining consent from the author.
E N D
Presentation Transcript
Ackumulerade reala inkomstkningar (deklarerade inkomster) sedan 1970 i USA Procentuell kning 250 200 150 USA vre 1% USA vre 10% 100 USA Nedre 90% 50 0 -50 K lla: The World Wealth and Income Database
Ackumulerade reala inkomstkningar (deklarerade inkomster) sedan 1970 i Sverige Procentuell kning 250 200 150 Sverige vre 1% Sverige nedre 90% 100 Sverige vre 10% 50 0 -50 K lla: The World Wealth and Income Database
Intergenerational mobility versus Inequality Mobility 0 -0.1 -0.2 -0.3 -0.4 -0.5 -0.6 -0.7 -0.8 20 25 30 35 40 45 50 55 Inequality
Intergenerational mobility versus Inequality Mobility 0 -0.1 -0.2 -0.3 -0.4 -0.5 -0.6 -0.7 -0.8 20 25 30 35 40 45 50 55 Inequality
Intergenerational mobility versus Inequality Mobility neg intergen earnings elasticity 0 -0.1 Norway Denmark Canada Finland -0.2 New Zealand Australia Sweden Germany -0.3 Japan Spain -0.4 France United States Singapore Switzerland Italy Pakistan Argentina -0.5 Chile United Kingdom Brazil -0.6 China Peru -0.7 -0.8 20 25 30 35 40 45 50 55 Inequality -- Gini coefficient Source: OECD Economic Surveys: Sweden 2017