Income Inequalities and Middle Class Evolution in Europe
Analyzing income disparities, middle class dynamics, and economic polarization within European countries from 2006 to 2021, focusing on factors such as income convergence, pandemic impact, and employment trends.
Download Presentation

Please find below an Image/Link to download the presentation.
The content on the website is provided AS IS for your information and personal use only. It may not be sold, licensed, or shared on other websites without obtaining consent from the author.If you encounter any issues during the download, it is possible that the publisher has removed the file from their server.
You are allowed to download the files provided on this website for personal or commercial use, subject to the condition that they are used lawfully. All files are the property of their respective owners.
The content on the website is provided AS IS for your information and personal use only. It may not be sold, licensed, or shared on other websites without obtaining consent from the author.
E N D
Presentation Transcript
Income inequalities and the middle class 17th Conference Social Monitoring and Reporting in Europe Rising Conflicts and Polarisation in European Societies? Indicators, Empirical Evidence, and Future Prospect Menaggio, 20 October 2023
Structure of the report Literature review Methodology Evolution of income inequalities Observing income from an EU-wide perspective Income convergence between EU countries An analysis of income inequalities within EU countries Middle classes and income polarisation across EU countries Size of the middle class Polarisation between income classes and within the middle class Groups specially hit by the pandemic, poverty and material deprivation In-house research. Focus on household disposable income Data: EU-SILC 2007/2021 (income 2006/2020). 2022 wave in DECEMBER 2023.
EU-wide income inequalities: between + within countries Declining EU-wide income inequalities: - Stability in income disparities WITHIN countries (although diverse cross-country patterns) - EU-wide inequality pushed downwards by income convergence BETWEEN countries (CEE catch-up) 0.25 0.2 0.15 0.1 0.05 0 2007 2008 2009 2010 2011 2012 2013 2014 2015 2016 2017 2018 2019 2020 2021 Theil-total Theil-between Theil-within
Income inequalities within countries: mixed patterns 2006-2020 Stability conceals diverse cross-country patterns Data depicts the Gini index
Income inequalities within countries: Great Recession and COVID Somewhat stronger inequality increases in the Great Recession (larger employment declines) but comparable picture Great Recession (2008-2009) COVID (2019-2020) 12 12 8 8 4 4 0 0 -4 -4 -8 -8 -12 -12 -16 -16 nl lu ie be mt fi si pl at bg dk de cy ee se it fr ro lt el hu lv hr es cz pt sk Income inq. pt lu nl ro hu se lv pl be cz fi fr bg el ee de at it es dk cy mt sk si lt ie hr Income inq. Income inq. (worst year) Employment Employment Data refers to the rate of change (%)
Income levels: Great Recession and COVID Strong income convergence between countries (2006-2020), CEE catch-up. What happened in the two crises? Very different picture when looking at changes in average income levels due to job-retention schemes keeping employment levels in 2020 Great Recession (2008-2009) COVID-19 (2019-2020) 12 12.00 8 8.00 4 4.00 0 0.00 -4 -4.00 -8 -8.00 -12 -12.00 -16 -16.00 -20 -20.00 -24 -24.00 at be bg cy cz de dk ee el es fi fr hr hu ie it lt lu lv mt nl pl pt ro se si sk at be bg cy cz de dk ee el es fi fr hr hu ie it lt lu lv mt nl pl pt ro se si sk Income Employment Income Income (worst year) Employment Data refers to the rate of change (%)
Income polarisation: income trends over distribution No clear sign of polarisation (averages across countries): the bottom of the income distribution doing relatively well from 2013 Data refers to averages across EU countries (index, 2007=100)
Income polarisation: size of the middle class No significant middle-class squeeze (only in Great Recession). 100 90 Income approach: 75- 200% median national income 80 70 60 50 40 30 20 10 0 2007 2008 2009 2010 2011 2012 2013 2014 2015 2016 2017 2018 2019 2020 2021 Low Middle High Data refers to averages across EU countries
Income polarisation: size of the middle class across countries Although the country picture is mixed, similar to that of income inequalities Data refers to change (in p.p.)
Income polarisation: middle class, Great Recession and pandemic Impact of the pandemic very different than that of the Great Recession Data refers to change (in p.p.)
Income polarisation: income growth across income classes 2006-2020: income levels grow more for the middle (and higher) class than the lower- class. They are more resilient in the crisis, when the lower-class is the most affected Data refers to the rate of change (%)
Income polarisation: income distance between income classes and within the middle class Again, no significant increase in income polarisation again, evidence that the lower-income class emerges as the one doing relatively worse (not the middle class, not becoming more dissimilar) The income distance for each individual is calculated as the difference in their income level and the following thresholds: 75% of the median income for people in the lower-income class; a specific median value calculated within the middle class for people in the middle-low and middle-high class; 200% of the median income for people in the higher-income class. Average across EU countries
Poverty and financial distress Objective (poverty rate) and more subjective measures (material deprivation, difficulty to make ends meet) indicators reflect again the difference between the Great Recession and the pandemic. 2021?? Left figure: data refers to averages across EU countries (in %). Right figure: Data refers to the rate of change (%)
Groups particularly affected by the pandemic in 2020 Income growth was much subdued in 2020 than in 2019 Lower-educated or one-adult households suffered income declines 8 6 4 2 0 -2 -4 Medium More adults 60+ male Two adults Yes 15/29 30/39 40/49 50/59 Low More adults+kids female High Single+kids No One adult 2 adults+kids Age Sex Edu HH type Child 2020-2021 2019-2020 Data refers to the rate of change (in %)
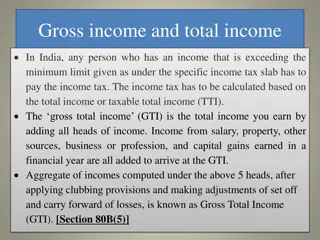
Conclusions EU-wide income inequality declining due to strong income convergence between EU countries Income inequalities rather stable overall, although with mixed country-patterns No signs of significant increase in income polarisation No signs of a clear middle-class squeeze (although limitations of the income approach should be considered) No significant increase in the overall income distances across income classes No polarisation within the middle class The lower-income class emerges as the most affected, not the middle class Results on the impact of the pandemic could be stronger once the new EU- SILC 2022 wave released in December 2023
Thank you for your interest! Carlos Vacas-Soriano Research manager, Eurofound cva@eurofound.europa.eu Forthcoming report: Income inequalities and the middle class
Unemployment and income levels (average across countries) 5 10 Change in income levels Unemployment 4 8 3 6 2 4 2 1 0 0 -1 -2 -2 -4 -3 -6 -4 -8 1 2 3 4 5 6 7 8 9 10 1 2 3 4 5 6 7 8 9 10 2009-13 2013-20 2020-21 2008-12 2012-19 2019-20
