Income Statements for Financial Accounting
Explore the basic structure of income statements including gross profit, operating profit, profit before taxes, and net income. Learn about net sales, cost of goods sold, and how to calculate COGS. Enhance your knowledge of financial accounting principles in this informative lecture.

Download Presentation

Please find below an Image/Link to download the presentation.
The content on the website is provided AS IS for your information and personal use only. It may not be sold, licensed, or shared on other websites without obtaining consent from the author. If you encounter any issues during the download, it is possible that the publisher has removed the file from their server.
You are allowed to download the files provided on this website for personal or commercial use, subject to the condition that they are used lawfully. All files are the property of their respective owners.
The content on the website is provided AS IS for your information and personal use only. It may not be sold, licensed, or shared on other websites without obtaining consent from the author.
E N D
Presentation Transcript
Entrepreneurship for Computer Science CS 15-390 Financial Accounting- Part IV Lecture 20, April 10, 2018 Mohammad Hammoud
Today Last Session: Quiz II Today s Session: Financial Accounting- Part IV Announcements: Quiz II grades are out CP3 is due on April 14. All teams will present their works in the last week of classes (i.e., in April 15 and April 17) PS4 will be out by tomorrow. It is due on April 19 by midnight
Basic Structure of Income Statements The basic structure of income statements involves 4 profit measures: 1. Gross profit Income Statement Company Name For the Time Period Ending Date 2. Operating profit (also referred to as Earnings Before Interest and Taxes or EBIT) Net Sales - Cost of Goods Sold 3. Profit before taxes (also referred to as Earnings Before Taxes or EBT) Gross Profit - Operating Expense Operating Profit - Interest Expense 4. Net income Profit Before Taxes - Taxes Net Income
Basic Structure of Income Statements The basic structure of income statements involves 4 profit measures: Net sales capture the revenue from sales Income Statement Company Name For the Time Period Ending Date Some of this revenue may never be collected Sales return may occur if a customer returns a defective, damaged, or otherwise undesirable product to the seller Sales allowance may occur if a customer agrees to keep a defective product in return for a reduction in the selling price Net Sales - Cost of Goods Sold Gross Profit - Operating Expense Operating Profit - Interest Expense Profit Before Taxes Net sales = Gross sales (returns & allowances) - Taxes Net Income
Basic Structure of Income Statements The basic structure of income statements involves 4 profit measures: Cost of Goods Sold (COGS) involves the direct costs attributable to the production of the goods sold For a retail company, direct costs are simply the costs of materials purchased for resale For a manufacturing company, direct costs can include the costs of production, depreciation, materials, and labor For a service company, direct costs may be negligible, hence, its income statement may exclude COGS Income Statement Company Name For the Time Period Ending Date Net Sales - Cost of Goods Sold Gross Profit - Operating Expense Operating Profit - Interest Expense Profit Before Taxes - Taxes COGS = Beginning Inventory + New Purchases - Ending Inventory Net Income
Basic Structure of Income Statements The basic structure of income statements involves 4 profit measures: Operating expenses include expenses other than COGS Examples: Management salaries Advertising expenditures Repairs and maintenance costs Research & development expenditures Lease payments Depreciation (also referred in this context to as allocated cost of fixed assets ) General and administrative expenses (which includes everything from salaries of office staff to paper clips) Income Statement Company Name For the Time Period Ending Date Net Sales - Cost of Goods Sold Gross Profit - Operating Expense Operating Profit - Interest Expense Profit Before Taxes - Taxes Net Income
Basic Structure of Income Statements The basic structure of income statements involves 4 profit measures: Interest expense captures the cost of borrowing money (typically from banks) Income Statement Company Name For the Time Period Ending Date Note: Dividends (or portions of company s earnings) are NOT deducted in the income statement. Rather, they are paid out of the net income Net Sales - Cost of Goods Sold Gross Profit - Operating Expense Operating Profit - Interest Expense Profit Before Taxes - Taxes Net Income
Basic Structure of Income Statements The basic structure of income statements involves 4 profit measures: Taxes are only paid after deducting interest expense Net income is the bottom-line profit (Net income/# of common shares outstanding) is referred to as Earning Per Share or EPS (Current market price of the stock/EPS) is referred to as P/E ratio Analysts often consider EPS and P/E ratios as important indicators of a company s current and potential future performance Income Statement Company Name For the Time Period Ending Date Net Sales - Cost of Goods Sold Gross Profit - Operating Expense Operating Profit - Interest Expense Profit Before Taxes - Taxes Net Income
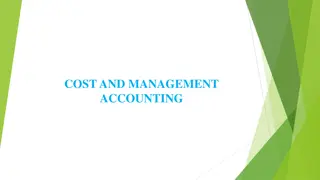
Interpreting Income Statements: An Example Income Statement X Inc. X Inc. X Inc. Income Statement Income Statement For the Year Ending December 31, 2017 For the Year Ending December 31, 2017 For the Year Ending December 31, 2017 Sales to Customers $5,200,000 Cost of Goods Sold -$3,900,000 Cost of Goods Sold -$3,900,000 Cost of Goods Sold -$3,900,000 Sales to Customers $5,200,000 Sales to Customers $5,200,000 Gross Profit $1,300,000 Gross Profit $1,300,000 Gross Profit $1,300,000 Less Selling, General, and Administrative Expenses Payroll $1,000,000 Rent $150,000 Utilities $75,000 Advertising $18,000 Allocated Cost of Store Equipment (Depreciation) $3,000 All Other $10,000 All Other $10,000 All Other $10,000 Less Selling, General, and Administrative Expenses Payroll $1,000,000 Rent $150,000 Utilities $75,000 Advertising $18,000 Allocated Cost of Store Equipment (Depreciation) $3,000 Allocated Cost of Store Equipment (Depreciation) $3,000 Less Selling, General, and Administrative Expenses Payroll $1,000,000 Rent $150,000 Utilities $75,000 Advertising $18,000 A catchall category for items not large enough to justify a separate line on the income statement Operating Profit (EBIT) $44,000 Operating Profit (EBIT) $44,000 Operating Profit (EBIT) $44,000 Less Interest Expenses $1,000 Less Interest Expenses $1,000 Less Interest Expenses $1,000 Profit Before Taxes $43,000 Profit Before Taxes $43,000 Profit Before Taxes $43,000 Less Federal and State Taxes $13,000 Less Federal and State Taxes $13,000 Less Federal and State Taxes $13,000 Net Income $30,000 Net Income $30,000 Net Income $30,000
Interpreting Income Statements: An Example Income Statement X Inc. X Inc. Income Statement For theYearEndingDecember 31, 2017 For theYearEndingDecember 31, 2017 Sales to Customers $5,200,000 Cost of Goods Sold -$3,900,000 Cost of Goods Sold -$3,900,000 Sales to Customers $5,200,000 Gross Profit $1,300,000 Gross Profit $1,300,000 Less Selling, General, and Administrative Expenses Payroll $1,000,000 Rent $150,000 Utilities $75,000 Advertising $18,000 Allocated Cost of Store Equipment (Depreciation) $3,000 All Other $10,000 All Other $10,000 Less Selling, General, and Administrative Expenses Payroll $1,000,000 Rent $150,000 Utilities $75,000 Advertising $18,000 Allocated Cost of Store Equipment (Depreciation) $3,000 What is EPS assuming the company has 1000 shares? $30 Operating Profit (EBIT) $44,000 Operating Profit (EBIT) $44,000 Less Interest Expenses $1,000 Less Interest Expenses $1,000 Profit Before Taxes $43,000 Profit Before Taxes $43,000 Less Federal and State Taxes $13,000 Less Federal and State Taxes $13,000 Net Income $30,000 Net Income $30,000
Basic Structure of Cash Flow Statements The basic structure of cash flow statements involves 3 main components 1. Cash From Operating Activities 2. Cash From Investing Activities 3. Cash From Financing Activities
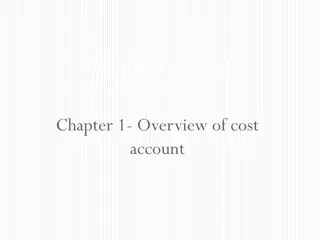
Interpreting Cash Flow Statements: An Example Cash Flow Statement X Inc. For the Year Ending December 31, 2017 Operating Activities These include any sources and uses of cash from business activities, which involve ONLY the current assets and current liabilities Net Income $30,000 Adjust Net Income for Noncash Expenses Depreciation +$3,000 $33,000 Adjust Net Income for Changes in Working Capital Current Assets For example, purchases or sales of long- term assets are NOT included in operating activities Increase in Accounts Receivables -$10,000 Increase in Inventory -$100,000 Current Liabilities Increase in Vendor Payable +$80,000 Increase in Wages Payable +$5,000 Increase in Taxes Payable +$2,000 $-23,000 Cash Flow from Operating Activities $10,000
Interpreting Cash Flow Statements: An Example Cash Flow Statement X Inc. For the Year Ending December 31, 2017 Operating Activities Net Income $30,000 Adjust Net Income for Noncash Expenses Depreciation +$3,000 Read from the income statement of X Inc. for the year ending December 31, 2017 $33,000 Adjust Net Income for Changes in Working Capital Current Assets Increase in Accounts Receivables -$10,000 Increase in Inventory -$100,000 Current Liabilities Increase in Vendor Payable +$80,000 Increase in Wages Payable +$5,000 Increase in Taxes Payable +$2,000 $-23,000 Cash Flow from Operating Activities $10,000
Interpreting Cash Flow Statements: An Example Cash Flow Statement X Inc. For the Year Ending December 31, 2017 Operating Activities Net Income $30,000 Adjust Net Income for Noncash Expenses Depreciation +$3,000 Step 1 $33,000 Adjust Net Income for Changes in Working Capital Current Assets Increase in Accounts Receivables -$10,000 Increase in Inventory -$100,000 Current Liabilities Increase in Vendor Payable +$80,000 Increase in Wages Payable +$5,000 Increase in Taxes Payable +$2,000 $-23,000 Cash Flow from Operating Activities $10,000
Interpreting Cash Flow Statements: An Example Cash Flow Statement X Inc. For the Year Ending December 31, 2017 Operating Activities Net Income $30,000 Adjust Net Income for Noncash Expenses Depreciation +$3,000 $33,000 Step 2 Adjust Net Income for Changes in Working Capital Current Assets Increase in Accounts Receivables -$10,000 Increase in Inventory -$100,000 Current Liabilities Increase in Vendor Payable +$80,000 Increase in Wages Payable +$5,000 Increase in Taxes Payable +$2,000 $-23,000 Cash Flow from Operating Activities $10,000
Interpreting Cash Flow Statements: An Example Cash Flow Statement X Inc. For the Year Ending December 31, 2017 Operating Activities Net Income $30,000 Adjust Net Income for Noncash Expenses Depreciation +$3,000 $33,000 Adjust Net Income for Changes in Working Capital Current Assets Increase in Accounts Receivables -$10,000 Increase in Inventory -$100,000 Current Liabilities Increase in Vendor Payable +$80,000 Increase in Wages Payable +$5,000 Increase in Taxes Payable +$2,000 $-23,000 Cash Flow from Operating Activities $10,000
Interpreting Cash Flow Statements: An Example Cash Flow Statement X Inc. For the Year Ending December 31, 2017 Operating Activities Net Income $30,000 Adjust Net Income for Noncash Expenses Depreciation +$3,000 $33,000 Adjust Net Income for Changes in Working Capital Current Assets Increase in Accounts Receivables -$10,000 Increase in Inventory -$100,000 Current Liabilities Increase in Vendor Payable +$80,000 Increase in Wages Payable +$5,000 Increase in Taxes Payable +$2,000 $-23,000 Cash Flow from Operating Activities $10,000
Interpreting Cash Flow Statements: An Example Cash Flow Statement X Inc. For the Year Ending December 31, 2017 Operating Activities Net Income $30,000 Adjust Net Income for Noncash Expenses Depreciation +$3,000 $33,000 Adjust Net Income for Changes in Working Capital Current Assets Increase in Accounts Receivables -$10,000 Increase in Inventory -$100,000 Current Liabilities Increase in Vendor Payable +$80,000 Increase in Wages Payable +$5,000 Increase in Taxes Payable +$2,000 $-23,000 Cash Flow from Operating Activities $10,000
Interpreting Cash Flow Statements: An Example Cash Flow Statement X Inc. For the Year Ending December 31, 2017 Operating Activities Net Income $30,000 Adjust Net Income for Noncash Expenses Depreciation +$3,000 $33,000 Adjust Net Income for Changes in Working Capital Current Assets Increase in Accounts Receivables -$10,000 Increase in Inventory -$100,000 Current Liabilities Increases in current assets use cash (hence, they are subtracted), while decreases in current assets produce cash (hence, they- if any- should be added) Increase in Vendor Payable +$80,000 Increase in Wages Payable +$5,000 Increase in Taxes Payable +$2,000 $-23,000 Cash Flow from Operating Activities $10,000
Interpreting Cash Flow Statements: An Example Cash Flow Statement X Inc. For the Year Ending December 31, 2017 Operating Activities Net Income $30,000 Adjust Net Income for Noncash Expenses Depreciation +$3,000 $33,000 Adjust Net Income for Changes in Working Capital Current Assets Increase in Accounts Receivables -$10,000 Increase in Inventory -$100,000 Current Liabilities Increase in Vendor Payable +$80,000 Increase in Wages Payable +$5,000 Increase in Taxes Payable +$2,000 $-23,000 Increases in current liabilities increase cash (hence, they should be added) and vice versa Cash Flow from Operating Activities $10,000
Interpreting Cash Flow Statements: An Example Cash Flow Statement X Inc. For the Year Ending December 31, 2017 Operating Activities Net Income $30,000 Adjust Net Income for Noncash Expenses Depreciation +$3,000 $33,000 Adjust Net Income for Changes in Working Capital Observation: Increases in current assets are uses of cash, while increases in current liabilities are sources of cash (and vice versa) Current Assets Increase in Accounts Receivables -$10,000 Increase in Inventory -$100,000 Current Liabilities Increase in Vendor Payable +$80,000 Increase in Wages Payable +$5,000 Increase in Taxes Payable +$2,000 $-23,000 Cash Flow from Operating Activities $10,000
Interpreting Cash Flow Statements: An Example Cash Flow Statement X Inc. For the Year Ending December 31, 2017 Operating Activities Net Income $30,000 Adjust Net Income for Noncash Expenses Depreciation +$3,000 $33,000 Adjust Net Income for Changes in Working Capital Current Assets Increase in Accounts Receivables -$10,000 Increase in Inventory -$100,000 Current Liabilities Increase in Vendor Payable +$80,000 Increase in Wages Payable +$5,000 Increase in Taxes Payable +$2,000 $-23,000 Cash Flow from Operating Activities $10,000
Interpreting Cash Flow Statements: An Example Cash Flow Statement X Inc. For the Year Ending December 31, 2017 Investing Activities These include any sources and uses of cash from the company's long-term investments, which involve ONLY noncurrent assets Purchase of Store Equipment -$30,000 Cash Flow from Investing Activities -$30,000 Financing Activities Proceeds from Bank Borrowing +$10,000 Sale of Stock to Owners +$15,000 For example, when the company buys or sells a building or an equipment, the cash relating to this transaction is reflected as an investing activity Payment of Dividends to Owners 0 Cash Flow from Financing Activities $25,000 Increase in Cash for the Year $5,000 Cash at Beginning of Year $0 Cash at End of Year $5,000 Increase in Cash for the Year $5,000
Interpreting Cash Flow Statements: An Example Cash Flow Statement X Inc. For the Year Ending December 31, 2017 Investing Activities Purchase of Equipment -$30,000 Cash Flow from Investing Activities -$30,000 Financing Activities Proceeds from Bank Borrowing +$10,000 Sale of Stock to Owners +$15,000 Payment of Dividends to Owners 0 Cash Flow from Financing Activities $25,000 Increase in Cash for the Year $5,000 Cash at Beginning of Year $0 Cash at End of Year $5,000 Increase in Cash for the Year $5,000
Interpreting Cash Flow Statements: An Example Cash Flow Statement X Inc. For the Year Ending December 31, 2017 Investing Activities Purchase of Equipment -$30,000 Cash Flow from Investing Activities -$30,000 Financing Activities Proceeds from Bank Borrowing +$10,000 Sale of Stock to Owners +$15,000 Payment of Dividends to Owners 0 Cash Flow from Financing Activities $25,000 Increase in Cash for the Year $5,000 Cash at Beginning of Year $0 Cash at End of Year $5,000 Increase in Cash for the Year $5,000
Interpreting Cash Flow Statements: An Example Cash Flow Statement X Inc. For the Year Ending December 31, 2017 Investing Activities Purchase of Equipment -$30,000 Cash Flow from Investing Activities -$30,000 These include the sources of cash from investors and/or banks, as well as the uses of cash paid to shareholders Financing Activities Proceeds from Bank Borrowing +$10,000 Sale of Stock to Owners +$15,000 Payment of Dividends to Owners 0 Cash Flow from Financing Activities $25,000 For example, payments of dividends, payments for stock repurchases, and the repayment of debt principle (loans) are considered as financing activities Increase in Cash for the Year $5,000 Cash at Beginning of Year $0 Cash at End of Year $5,000 Increase in Cash for the Year $5,000
Interpreting Cash Flow Statements: An Example Cash Flow Statement X Inc. For the Year Ending December 31, 2017 Investing Activities Purchase of Equipment -$30,000 Cash Flow from Investing Activities -$30,000 Financing Activities Proceeds from Bank Borrowing +$10,000 Sale of Stock to Owners +$15,000 Payment of Dividends to Owners 0 Cash Flow from Financing Activities $25,000 Increase in Cash for the Year $5,000 Cash at Beginning of Year $0 Cash at End of Year $5,000 Increase in Cash for the Year $5,000
Interpreting Cash Flow Statements: An Example Cash Flow Statement X Inc. For the Year Ending December 31, 2017 Investing Activities Purchase of Equipment -$30,000 Cash Flow from Investing Activities -$30,000 Financing Activities Proceeds from Bank Borrowing +$10,000 Sale of Stock to Owners +$15,000 Payment of Dividends to Owners 0 Cash Flow from Financing Activities $25,000 Increase in Cash for the Year $5,000 Cash at Beginning of Year $0 Cash at End of Year $5,000 Increase in Cash for the Year $5,000
Interpreting Cash Flow Statements: An Example Cash Flow Statement X Inc. For the Year Ending December 31, 2017 Investing Activities Purchase of Equipment -$30,000 Cash Flow from Investing Activities -$30,000 Financing Activities Proceeds from Bank Borrowing +$10,000 Sale of Stock to Owners +$15,000 Payment of Dividends to Owners 0 Cash Flow from Financing Activities $25,000 Increase in Cash for the Year $5,000 Cash at Beginning of Year $0 Cash at End of Year $5,000 Increase in Cash for the Year $5,000
Interpreting Cash Flow Statements: An Example Cash Flow Statement X Inc. For the Year Ending December 31, 2017 Investing Activities Purchase of Equipment -$30,000 Cash Flow from Investing Activities -$30,000 Financing Activities Proceeds from Bank Borrowing +$10,000 Sale of Stock to Owners +$15,000 Payment of Dividends to Owners 0 Cash Flow from Financing Activities $25,000 Increase in Cash for the Year $5,000 Cash at Beginning of Year $0 Cash at End of Year $5,000 Increase in Cash for the Year $5,000
Interpreting Cash Flow Statements: An Example Cash Flow Statement X Inc. For the Year Ending December 31, 2017 Investing Activities Purchase of Equipment -$30,000 Cash Flow from Investing Activities -$30,000 Financing Activities Proceeds from Bank Borrowing +$10,000 Sale of Stock to Owners +$15,000 Payment of Dividends to Owners 0 Cash Flow from Financing Activities $25,000 Increase in Cash for the Year $5,000 Cash at Beginning of Year $0 Cash at End of Year $5,000 Increase in Cash for the Year $5,000
Interpreting Cash Flow Statements: An Example Cash Flow Statement X Inc. For the Year Ending December 31, 2017 Investing Activities Purchase of Equipment -$30,000 Cash Flow from Investing Activities -$30,000 Financing Activities Proceeds from Bank Borrowing +$10,000 Sale of Stock to Owners +$15,000 Payment of Dividends to Owners 0 Cash Flow from Financing Activities $25,000 Increase in Cash for the Year $5,000 Cash at Beginning of Year $0 Cash at End of Year $5,000 Increase in Cash for the Year $5,000
Next Class Students presenting their final projects