Increasing Online Survey Response Rates - Students' Feedback Process
Online surveys play a crucial role in gathering students' feedback on courses and instructors. This content discusses the process of administering online surveys, focusing on systems used, authentication methods, and communication strategies. It provides insights into the challenges students face with multiple survey requests and offers solutions to enhance response rates effectively.
Uploaded on Feb 27, 2025 | 2 Views
Download Presentation

Please find below an Image/Link to download the presentation.
The content on the website is provided AS IS for your information and personal use only. It may not be sold, licensed, or shared on other websites without obtaining consent from the author.If you encounter any issues during the download, it is possible that the publisher has removed the file from their server.
You are allowed to download the files provided on this website for personal or commercial use, subject to the condition that they are used lawfully. All files are the property of their respective owners.
The content on the website is provided AS IS for your information and personal use only. It may not be sold, licensed, or shared on other websites without obtaining consent from the author.
E N D
Presentation Transcript
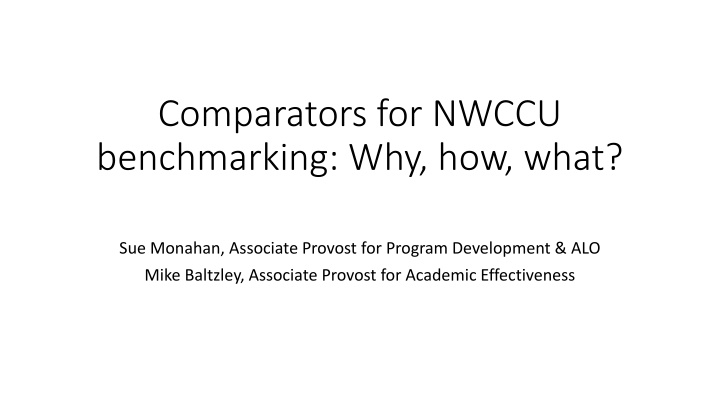
Comparators for NWCCU benchmarking: Why, how, what? Sue Monahan, Associate Provost for Program Development & ALO Mike Baltzley, Associate Provost for Academic Effectiveness
Why? Evidence of student achievement supports continuous improvement in how we serve students.
It is also required for NWCCU accreditation. Specifically, NWCCU requires evidence that speaks to: recruitment and admission of students with the potential to benefit, along with orientationfor students sharing academic requirements and policies. established and widely shared student achievement indicators disaggregated in meaningful categories for the purpose of promoting continuous improvement in student achievement and closing barriers to academic excellence and success (equity gaps) in comparison with regional and national peer institutions. transparent processes and methodologies for collecting and analyzing indicators of student achievementto inform and implement strategies to mitigate perceived gaps in achievement and equity.
How? Be transparent in selection process. Identify potential comparators via IPEDS using thoughtfully chosen criteria. Consider other factors.
Criteria, as captured in IPEDS, generated 17 peer institutions Public 2019-20, Sector of institution (Institutions)=1 (Public, 4-year or above) Masters-level colleges and universities 2019-20, Carnegie Classification 2018: Basic (Institutions) = 18, 19 or 20 (Masters colleges and universities, small, medium, larger programs) Undergraduate array is a mix of professional and arts/sciences, with some graduate overlap 2019-20, Carnegie Classification 2018: Undergraduate Instructional Profile (Institutions) = 10, 13 or 16 (Arts & Sciences plus professions- some graduate coexistence, Balanced Arts & Sciences/Professions-some graduate coexistence, Professions plus Arts & Sciences-some graduate coexistence) High or very high undergraduate emphasis 2019-20, Carnegie Classification: Enrollment Profile (Institutions) = 3 or 4 (High or Very High Undergraduate) Between 1000 and 9999 students 2019-20, Institutional Size Category (Institutions) = 2 or 3 (1,000 4,999 or 5,000 9,999) Undergraduate acceptance rate 2019-20, Percent Admitted (Selectivity and admissions yield) ranges from 79% to 89% (WOU was 84%) Core revenues 2018-19, Core Revenues, Total Dollars (Financial indicators) ranges from $70m to $120m (WOU was $95m in 2018) Percent Pell Eligible 2018-19, Percent of first-time, full-time undergraduates awarded Pell grants (Student financial aid) ranges from 31% to 55% (WOU was 43% in 2018) IPEDS Compare Institutions tool Criteria can all be found under By Variables -> Browse/Search by Variables -> Frequently used/derived variables
Public Masters Regional Comprehensives (n=256, Carnegie Basic code = 18, 19, 20) Select for undergraduate instructional programs and enrollment profile WOU is in 2 (1000-4999) but we aspire to be in 3 (5000-9999), leaving us with 149 potential peers.
149 public, regional, masters-granting universities, with between 1,000 and 9,999 students, and high/very high undergraduate service, Arts & Science/Professional program array Acceptance rate of 79-89% (n= 41) (+ 5 percentage points from WOU s 84% rate)
Core revenues between $70m and $120m (WOU = $95m in 2018) and Pell (+ 12 percentage points, 31% - 55%): n = 17 Arizona State University-West Arizona State University-Polytechnic Indiana University-South Bend Plymouth State University University of Washington-Bothell Campus University of Washington-Tacoma Campus Emporia State University University of Wisconsin-Green Bay Longwood University Western Oregon University Edinboro University of Pennsylvania Northwest Missouri State University Westfield State University East Stroudsburg University of Pennsylvania Shippensburg University of Pennsylvania Colorado Mesa University Western Connecticut State University
Comparators when Pell range is narrowed to 37%-55% Shippensburg University of Pennsylvania Northwest Missouri State University Colorado Mesa University Emporia State University Edinboro University of Pennsylvania East Stroudsburg University of Pennsylvania University of Washington-Tacoma Campus THEN, considering other factors: Eliminate Edinboro University of Pennsylvania because it is being merged with two other PSU satellite campuses. Add Oregon regional peers: Southern Oregon University Eastern Oregon University Add one more peer from the west from list of 17: Arizona State University-West Add one California State University system institution: Cal State: Channel Islands which fell out of peers based on Core Revenues only ($195M in 2018-19)
What? Ten comparators identified Shippensburg University of Pennsylvania Northwest Missouri State University Colorado Mesa University Emporia State University East Stroudsburg University of Pennsylvania University of Washington-Tacoma Campus Southern Oregon University Eastern Oregon University Arizona State University-West California State University-Channel Islands
Next steps for NWCCU benchmarking Identify indicators of student achievement Retention rates Graduation rates Disaggregation of data to identify equity gaps Campus conversation about student achievement and any equity gaps identified Action plans USE THE DATA to inform practice
