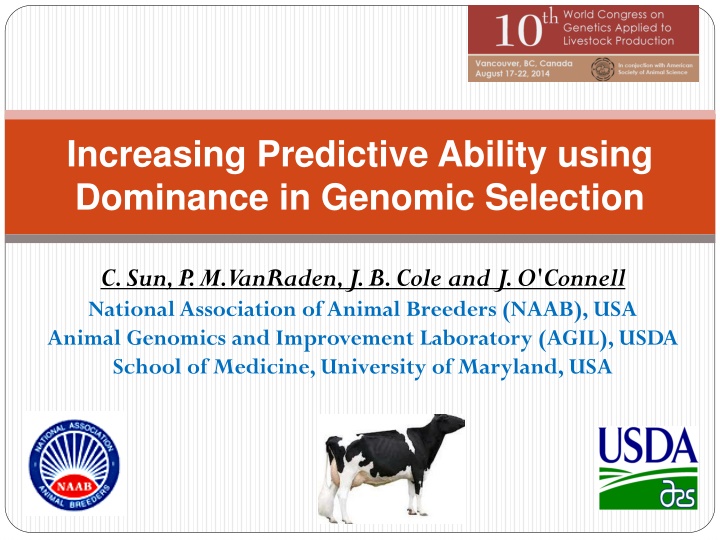
Increasing Predictive Ability using Dominance in Genomic Selection
Dominance is a crucial genetic effect in genomic selection. This study investigates estimating variance components and comparing predictive models for dairy cattle traits, involving additive and dominance effects. The objective is to enhance the accuracy of genomic predictions by including dominance information in the models.

Download Presentation

Please find below an Image/Link to download the presentation.
The content on the website is provided AS IS for your information and personal use only. It may not be sold, licensed, or shared on other websites without obtaining consent from the author.If you encounter any issues during the download, it is possible that the publisher has removed the file from their server.
You are allowed to download the files provided on this website for personal or commercial use, subject to the condition that they are used lawfully. All files are the property of their respective owners.
The content on the website is provided AS IS for your information and personal use only. It may not be sold, licensed, or shared on other websites without obtaining consent from the author.
E N D
Presentation Transcript
Increasing Predictive Ability using Dominance in Genomic Selection C. Sun, P. M. VanRaden, J. B. Cole and J. O'Connell National Association of Animal Breeders (NAAB), USA Animal Genomics and Improvement Laboratory (AGIL), USDA School of Medicine, University of Maryland, USA
Introduction Dominance is an important non-additive genetic effect resulting from interactions between alleles at the same locus Most of prediction models for dairy cattle have included only additive effects in genomic selection Limited number of cows with both genotypes and phenotypes Requiring greater computing resources
Introduction Recently a few publications investigated dominance using SNPs (Su G, et al 2012; Sun C, et al 2013; Boysen TJ, et al 2013; Vitezica, ZG et al 2013; Da Y, et al 2014; Nishio M, et al 2014; ) Most of them using simulated or small real data Large data set with very many different kinds of relationships help to partition variation into many components in principle using modern statistical methods with the animal model (Hill, et al; 2008) The increasing availability of cows with phenotypes and genotypes in the United States Mating program including dominance earn benefit (Sun et al; 2013)
Introduction Objective 1. Estimating additive and dominance variance components using Holstein and Jersey data for six traits 2. Comparing predictive ability of models that included additive and dominance effects with that of a model including only additive effects 3. Comparing predictions obtained using two different dominance coefficients 4. Testing model prediction by expanding the data set to include cows with derived genotype probabilities based on ancestor genotypes
Materials and Methods Data 1.DATAC 2.DATAS-D :Cows with own genotypes and phenotypes :Cow with phenotypes but genotype probabilities were calculated from genotyped sire and dam 3.DATAS-MGS:Cows with phenotypes but genotype probabilities were calculated from genotyped sire and MGS Each sire-MGS pair was required to have 20 observations for Holsteins and 8 observations for Jerseys Fixed effects (age and parity group, herd management group, inbreeding, and heterosis) were first estimated using a multi-trait and multi-breed linear mixed model Records from first parity were adjusted for fixed effects
Materials and Methods Milk ( Fat , Protein ) 30,482 25,926 33,897 (2,278,652) 8,321 4,896 PL 14,780 - - 5,492 - DPR 23,811 - - 7,422 - SCS 30,352 - - 8,292 - Cows S-D S-MGS Cows S-D HO JE 11,823 (379,713) - - - S-MGS All genotypes were imputed to a BovineSNP50 basis using findhap.f90 software before estimating genomic BV and dominance effects.
Materials and Methods Two different Dominance coefficient matrices k i = (1 2 D HH / 2 ) pq pq Dominant Values 1 i i i i = 1 2 if homozygous if heterozygous i p q p q = H i i 1 2 i k i = 2 D MM / (2 ) pq Dominant Deviations 2 i i = 1 2 p q q for genotype codes 0 for genotype codes 1 for genotype codes 2 p 2 i = 2 M i i 2 2 i
Materials and Methods Models for variance components (MA) = + + y 1u Wa e = = = + + + + + + y y y 1u Wa 1u Wa 1u 1 Wd Wd + 1 (MAD) e + e ' S-MGS S-MGS 3 + + 1 u Wa 1 1 2 (MAD2) Wd 2 u 2 + ' e 3 (MAD3) S-D S-D 3 SNP additive and dominance effect SNP-BLUP method with the variance components described previously
Materials and Methods DATAC DATAC MA MAD MAD2 DATAS-D DATAS-MGS Estimate variance components MAD3 SNP-BLUP Estimate SNP additive and dominance effects Ten-fold cross validation
Results 2 a 2 d 2 a 2 d 2 a 2 d 2 e 2 e 2 a 2 d 2 e 2 e C S C S D D 2 a 2 e Variance components Breed Model h2 Milk Fat Protein PL DPR SCS HO MA MAD Add Add Dom Add Dom Add Dom Add Add Dom Add Dom Add Dom 0.288 0.270 0.051 0.285 0.037 0.215 0.024 0.352 0.322 0.070 0.344 0.054 0.271 0.052 0.253 0.233 0.051 0.250 0.034 0.202 0.024 0.222 0.192 0.072 0.214 0.055 0.182 0.058 0.221 0.202 0.053 0.217 0.039 0.186 0.025 0.258 0.230 0.070 0.251 0.056 0.206 0.054 0.043 0.042 0.000 0.042 0.005 0.071 0.057 0.038 0.070 0.024 0.056 0.057 0.000 0.056 0.000 0.034 0.030 0.012 0.034 0.000 0.087 0.084 0.010 0.087 0.010 0.102 0.098 0.012 0.102 0.010 MAD2 MAD3 JE MA MAD MAD2 MAD3
Results 2 a 2 d 2 a 2 d 2 a 2 d 2 e 2 e 2 a 2 d 2 e 2 e C S C S D D 2 a 2 e Variance components 1.Dominance variances were very small for PL, DPR and SCS regardless of breed, especially for DPR. 2.Two different dominance coefficient had a little difference on estimate additive and dominance heritabilities, but the sum of additive and dominance variances were similar 3.Based on two dominance coefficients (D1 and D2), dominance variance accounted for 5% and 4%, respectively, of phenotypic variance for Holstein yield traits and 7% and 5.5% of Jersey yield traits. 4.Including cows with derived genotype probabilities, additive heritability estimates were lower for both Holstein and Jersey; dominance variances were smaller for Holsteins.
Results 2 a 2 d 2 a 2 d 2 a 2 d 2 e 2 e 2 a 2 d 2 e 2 e C S C S D D Prediction Accuracy Average correlations between phenotype and genetic effects from ten- fold cross validation 2 a 2 e For PL, DPR and SCS, the models including dominance did not improve prediction due to very small dominance variances For yield traits, models including dominance have better prediction 0.47 0.47 Milk (JE) Add Add+Dom Milk (HO) Add Add+Dom 0.45 0.45 0.43 0.43 0.41 0.41 0.39 0.39 0.37 0.37 MA MAD MAD2 MAD3 MA MAD MAD2 MAD3
Results 2 a 2 d 2 a 2 d 2 a 2 d 2 e 2 e 2 a 2 d 2 e 2 e C S C S D D Prediction Accuracy 2 a 2 e The differences between correlations from MAD or MAD2 and that from MA were statistically significant for Holstein and Jersey yield traits (P < 0.001) For models including dominance, the standard deviation of correlations from ten-fold cross-validation ranged from 0.017 to 0.024 for Holstein, and from 0.016 to 0.027 for Jersey on yield traits Enlarging the data set using Sire-MGS data did not improve prediction for either Holsteins or Jerseys.
Results 2 a 2 d 2 a 2 d 2 a 2 d 2 e 2 e 2 a 2 d 2 e 2 e C S C S D D Largest SNP effects 2 a 2 e The largest additive SNP effects are chromosome DGAT1 for all three yield traits and both breeds. located 14 on near For Holstein milk and fat yields as well as Jersey fat yield, the SNP with largest additive effect also had the largest dominance effect
Discussions 2 a 2 d 2 a 2 d 2 a 2 d 2 e 2 e 2 a 2 d 2 e 2 e C S C S D D 2 a 2 e For DPR fertility trait, Dominance variance close to zero Inbreeding depression implies directional dominance in gene effects but, for a given rate of inbreeding depression, as the number of loci increases and the gene frequencies move toward 0 or 1.0, the dominance variance decreases towards zero ( Hill, et al; 2008) Homozygous lethal embryo is lost Including cows with derived genotype probabilities did not improvement prediction ability A better model might treat the three groups as correlated phenotypes to account for differences in genotype accuracy and phenotype distributions between them. Pre-selection may have affected the results and caused bias
Conclusions 2 a 2 d 2 a 2 d 2 a 2 d 2 e 2 e 2 a 2 d 2 e 2 e C S C S D D 2 a 2 e Dominance variance accounted for about 5 and 7% of total variance for yield traits for Holsteins and Jerseys, respectively For PL, DPR, SCS, dominance variances were very small The MAD model had smaller additive and larger dominance variance estimates compared with MAD2 Based on ten-fold cross-validation, the models including dominance can increase prediction ability for yield traits; improvements from MAD and MAD2 were similar.
Conclusions 2 a 2 d 2 a 2 d 2 a 2 d 2 e 2 e 2 a 2 d 2 e 2 e C S C S D D 2 a 2 e Prediction accuracy from 30,000 cows did not further improve by including 2 million more cows with derived genotypes The largest additive effects were located on chromosome 14 for all three yield traits for both breeds, and those SNP also had the largest dominance effects for fat yield as well as Holstein milk yield Dominance effects can be considered for inclusion in routine genomic evaluation models to improve prediction accuracy and exploit specific combining ability