Increasing Threats to Groundwater Quality in Coastal Regions
Groundwater, a vital water source in India, is facing escalating challenges due to factors like seawater intrusion, industrial effluents, and unsustainable practices. This study explores the impact on groundwater quality in coastal aquifers, emphasizing the need for sustainable management and quality assessment to prevent further deterioration. Mathematical models play a crucial role in maximizing fresh water extraction while minimizing saltwater intrusion. The focus is on Chittoor district, a chronically drought-affected region in India.

Download Presentation

Please find below an Image/Link to download the presentation.
The content on the website is provided AS IS for your information and personal use only. It may not be sold, licensed, or shared on other websites without obtaining consent from the author.If you encounter any issues during the download, it is possible that the publisher has removed the file from their server.
You are allowed to download the files provided on this website for personal or commercial use, subject to the condition that they are used lawfully. All files are the property of their respective owners.
The content on the website is provided AS IS for your information and personal use only. It may not be sold, licensed, or shared on other websites without obtaining consent from the author.
E N D
Presentation Transcript
Dr. Venkata Ramana Rao Narapraju Professor of Civil Engineering & Registrar JNTUH , Hyderabad , India E-mail : rao.nvr@gmail.com Dr. Kasi Viswanadh Gorthi Professor of Civil Engineering & OSD to Vice-Chancellor , JNTUH, Hyderabad , India Email : gkviswanadh@jntuh.ac.in
Introduction Study area Methodology Results and Discussions Conclusions
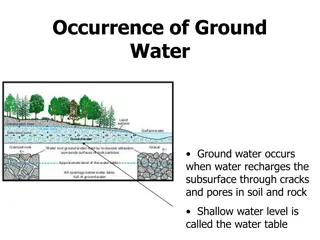
Groundwater has emerged as the primary democratic water source and poverty reduction tool Due to its low capital cost, it is the most preferred source of water in India. Ground water has made significant contributions to the growth of India s Economy and has been an important catalyst for its socio economic development. Its importance as a precious natural resource in the Indian context can be gauged that more than85 % of India s rural domestic water requirements, 50% of its urban water requirements and more requirements are met from G.W resources. than 50% of its irrigation
Coastal aquifers prove to be an important source of ground water resource. Seawater is the most common pollutant of fresh water in coastal aquifers Seawater intrusion in fresh water aquifers- Results from the activities of Man. Excessive ground water pumping Deterioration of water quality Dictating expensive remedies
Stress on groundwater, both in terms of quality and quantity, are increasing rapidly to growing demands, significant changes in land use pattern, sea water intrusion, industrial effluents, domestic effluent etc. The need to assess the groundwater quality is becoming increasingly important as groundwater sources become more and more contaminated by seawater intrusion, industrial unsustainable agricultural practices. effluents and
Goal Maximize fresh water extraction without causing invasion of salt water into the wells. Mathematical models provide a quantitative frame work for analyzing data from monitoring and assess quantitative responses of the groundwater systems subjected to external stresses of coastal aquifer management
Chittoor district is one of the chronically drought affected. It covers a geographical area of 15,152 sq. km and situated between 12 37 and 14 00 North latitudes and 78 03 and 79 55 Eastern longitudes. The district receives moderate rainfall. Failure of monsoons during the last few years lead to failure of bore wells and failure of crops. The soils of the district on the basis of village records are 57% Red loamy soils, 34% red sandy soils. The remaining 9% is covered by black clay (3%), black loamy (2%), black sandy (1%) and red clayey (3%).
The annual rainfall of the district is 943 mm, which ranges from 600 mm at Molakacheruvu mandal to 1280 mm at Sri Kalahasti mandal. In the district level, the cumulative departure of annual rainfall was scanty i.e., more than 60% below normal, in 35 mandals and deficit i.e., below normal by 20% and 59% in 11 mandals. In the remaining 20 mandals the rainfall was above normal. On an average, the district rainfall condition was deficient by 61% from normal.
Chittoor district is absolutely dependant on ground water for its irrigation and domestic needs. Out of the total irrigated land, 84.34% area is irrigated through 1,16,623 dug wells, 19,849 shallow bore wells and 28,933 deep bore wells. For irrigation purpose, there are 12,618 diesel engines and 99,402 electric pumps in the district. Drinking habitations are met through 6229 PWS & MPWS schemes and 20,368 bore wells. and domestic requirements of 10804
The overall stage of ground water development of the district is 72% and categorized as semi- critical. Out of the total 66 mandals, only 28 mandals are under safe category categorized as semi-critical category. and 11 mandals are There are as many as 781 villages declared as over-exploited villages out of 1540 revenue villages.
As such, there are no existing major irrigation projects in the district. Though there are some ongoing irrigation projects, no irrigation through surface water except tank irrigation is being practiced. Only, 15% of area is irrigated through surface water under tanks. About, 84% of the irrigated area is through ground water, out of which 66% is by bore wells.
The net ground water availability in the district is 1450.10 MCM. Ground water utilization is 1038.25 MCM and the ground water balance for future irrigation development is 411.85 MCM. The stage of ground water development arrived at 72% and hence the district falls under semi-critical category.
Based on the stage of development, 28 mandals are categorized as safe, 11 as semi-critical, 9 as critical and 18 as over-exploited. The development is in B.N. Kandriga (20%) and the highest development is in Tirupati (Rural) (98%). minimum stage of ground water Penumuru mandal of Chittoor district has 38% of excess rainfall and has been categorized as over- exploited as per stage development of ground water
Penumuru Mandal in Chittoor District of Andhra Pradesh State, India. belongs to Rayalaseema region and is located 24 KM towards North from District head quarters Chittoor, 530 KM from State capital Hyderabad towards North. Penumuru Mandal is bounded by by Puthalapattu Mandal towards west, Pakala Mandal towards North, Gangadhara Nellore Mandal towards South, Vedurukuppam Mandal towards East. Penumuru mandal consists of 169 Villages and 24 Panchayats. Thathireddipalle is the smallest Village and Penumuru is the biggest Village.
The quality of groundwater has been studied by collecting water samples from five villages of Penumuru mandal namely Matampalli, Gangupalli, Nanjarpalli, Satambakam & Settipalli in the month of January, 2014. Twenty samples have been collected out which 19 have been collected from bore wells and 1 from Open dug well. These samples are analyzed for groundwater quality for the following parameters/ions, viz., pH, EC, TH, DO, Na, K and Alkalinity.
The objectives of present work are as follows: To analyse groundwater following parameters/ions, viz., pH, EC, TH, DO, Na, K and Alkalinity. To assess groundwater suitability for irrigation and drinking purposes. quality for the quality and its
The rainfall data was collected from the groundwater department and the water samples have been collected from the bore wells of the fields. The samples were analyzed for different ion concentration. The methodology includes Collection of hydrology particulars of wells Collection of rainfall data Collection of water samples Analysis of collected water samples.
Water samples were analyzed and the obtained values were compared with standard values. The drinking water standards of WHO (1971 and 2006) and Bureau of national standards (1983 and 1991) was the basis for the groundwater quality evaluation for drinking purpose. The chemical analysis of the samples for the following parameters/ions, viz., DO, pH, TH, EC, Na, K and Alkalinity are given in Table 1.
EC ( S/ cm) DO (mg/l) TH (mg/l) Na K Alkalinity (ppm) S. No. Sample No. Village pH (mg/l) (mg/l) 1 2 3 4 5 6 7 8 9 10 11 12 13 14 15 16 17 18 19 20 PM1 PM2 PM3 PM4 PM5 PN1 PN2 PG1 PG2 PG3 PS1 PS2 PS3 PS4 PS5 PS6 PSC1 PSC2 PSC3 PSC4 Matampalle Matampalle Matampalle Matampalle Matampalle Nanjarpalle Nanjarpalle Gangupalle Gangupalle Gangupalle Satambakam Satambakam Satambakam Satambakam Satambakam Satambakam Settipalle Settipalle Settipalle Settipalle 2.8 1.8 5.0 4.2 6.0 8.0 9.0 5.4 5.4 8.0 8.0 8.4 9.2 5.4 7.4 7.6 9.8 8.2 9.0 8.2 7.3 7.2 7.2 7.1 7.1 7.3 7.2 7.1 7.2 7.4 7.5 7.5 7.4 7.2 7.1 7.2 7.1 7.2 7.4 7.2 360 350 425 430 760 405 465 325 355 455 265 300 330 310 275 740 230 325 530 340 1200 1260 1260 540 1740 960 880 660 780 680 600 620 580 580 640 620 200 540 200 360 318 320 320 314 309 390 386 284 300 300 190 188 175 178 194 194 74 102 84 82 3.0 1.5 2.2 1.4 1.6 6.0 5.2 4.1 4.5 4.4 0.5 0.8 1.2 1.0 1.1 1.6 1.0 1.5 1.1 2.3 765 1155 725 760 340 380 540 670 745 710 855 895 710 660 690 520 460 835 520 675
Dissolved Oxygen: DO value in the majority of study area is between 4-8mg/l, and is within permissible limit. Matampalle village is having DO value less than 4mg/l, it will not suit for aquatic life.
pH: pH value represents the concentration of hydrogen ions in water and is measure of acidity and alkalinity of water. pH value below 7.0 indicate acidic character while pH greater than 7.0 is indicative of alkaline character of water. Theaveragevalue for the study area is 7.2, the water is slightly alkaline. However pH values is within permissible limit.
Total Hardness: Hardness is attributed principally to Ca and Mg. Hardness is also considered as total hardness is expressed in mg/l of equivalent CaCO3. Most of the study area is having hard water as hardness is more than 300 ppm. Settipalle village has been reported of hardness more than 500 ppm.
Electrical Conductivity: The EC value in the area of study ranges between 500-1000 S/cm. The average value of EC is 745 S/cm.
Sodium: The average value of sodium obtained in the study area is 235mg/l which is more than the permissible value.
Potassium: The average value for potassium in the study area is 3.4.
Alkalinity: Normal range of alkalinity in the area of study is 500-1000mg/l and the average value is 680mg/l. Alkalinity is quite high and it shows higher resistance towards changes in pH.
The significant role in the crop productivity and human as well as cattle health. quality of groundwater plays a Chemistry of groundwater in the area is studied with respect to the major cation, sodium and potassium. Chemically related properties such as pH, TDS, TH are also discussed.
Dissolved permissible limit except in Matampalli village and its range in study area is in between 4-8mg/l. oxygen content is within the pH value in the study area is slightly higher. Total Hardness and Alkalinity are more than the permissible limit, water is not good for industrial purposes as it is hard, it can be used for domestic purposes as there is no considerable health effect due to hardness.
Alkalinity is just a measure of acid neutralizing capacity of water so even its higher value is not harmful for its use in drinking and irrigation purpose. Normal range of alkalinity in the area of study is 500- 1000mg/l and the average value is 680mg/l. Alkalinity is quite high and it shows higher resistance towards changes in pH. Sodium is slightly more than the permissible limit. The average value of sodium obtained is 235mg/l which is more than the permissible value.
Normal range of alkalinity in the area of study is 500-1000mg/l and the average value is 680mg/l. Alkalinity is quite high and it shows higher resistance towards changes in pH. Sodium is slightly more than the permissible limit. The average value of sodium obtained is 235mg/l which is more than the permissible value.
Failure of the monsoon leads to less recharge to ground water and more draft from ground water reservoir. As a result, water levels are declined, which lead to drying up of dug wells in many of the mandals and also in reduction of yields of bore wells. This necessitates construction of additional bore wells to provide water to the standing crop. More often, the new bore wells are likely to be a failure because of absence/de-saturation aquifers.
In the over exploited areas, large-scale artificial recharge to ground water has to be taken up at appropriate places on scientific lines, involving all stakeholders. Maintenance of these structures should be made mandatory by providing budget.
Mass conducted in rural areas to educate the farmers regarding the ground water management to update their knowledge. Training for local government functionaries, NGOs, voluntary Organizations in watershed management activities needs to be imparted on the scientific techniques in selection of site, design of structure, etc. for construction of artificial recharge structure. awareness programmes should be