India's Expenditure on Elementary Education: Trends and Analysis
Explore the significant developments in elementary education in India, including initiatives like Sarva Shiksha Abhiyan and the Right to Free and Compulsory Education Act. Discover the public and private expenditure per child, the distribution of funds, and the ratio of public to private expenditure across different states.
Download Presentation

Please find below an Image/Link to download the presentation.
The content on the website is provided AS IS for your information and personal use only. It may not be sold, licensed, or shared on other websites without obtaining consent from the author. If you encounter any issues during the download, it is possible that the publisher has removed the file from their server.
You are allowed to download the files provided on this website for personal or commercial use, subject to the condition that they are used lawfully. All files are the property of their respective owners.
The content on the website is provided AS IS for your information and personal use only. It may not be sold, licensed, or shared on other websites without obtaining consent from the author.
E N D
Presentation Transcript
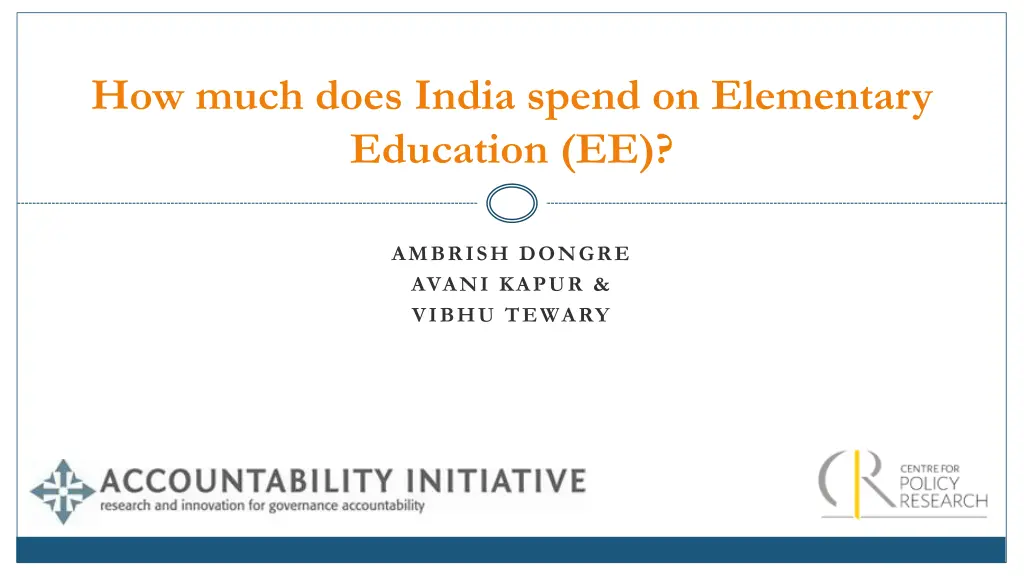
How much does India spend on Elementary Education (EE)? AMBRISH DONGRE AVANI KAPUR & VIBHU TEWARY
Context Significant developments in EE in India 2001: Centrally Sponsored Scheme (CSS) Sarva Shiksha Abhiyan(SSA) launched 2009: Right to Free and Compulsory Education Act (RTE) passed resulting in significant increases in allocations for SSA. Increasing focus on private provision of education private schools (36%); private tutoring (23%) 2015: Implications of 14thFinance Commission recommendations Despite this, updated estimates on total expenditure on EE are not available
Motivation Questions How much does it cost to educate India s children? What are the drivers of public expenditure? Unpack the sources of funds (who controls the purse-strings and who has the decision-making power? )
How much are we spending (per child)?- Public Himachal Pradesh 27,073 Uttarakhand 20,596 Jammu & Kashmir 18,304 Haryana 17,817 Karnataka 15,300 Gujarat 13,377 Chhattisgarh 12,160 Rajasthan 11,576 Uttar Pradesh 9,255 Public expenditure per student enrolled in government school Odisha 8,424 Madhya Pradesh 8,066 Punjab 7,577 Jharkhand 6,031 West Bengal 5,957 Bihar 4,515 0 5,000 10,000 15,000 20,000 25,000 30,000
How much are we spending (per child)?- Private % of students enrolled in private schools Himachal Pradesh Punjab Haryana Tamil Nadu Jammu & Kashmir West Bengal Gujarat Assam Karnataka Maharashtra Chhattisgarh Odisha Uttarakhand Andhra Pradesh Kerala Rajasthan Jharkhand Bihar Madhya Pradesh Uttar Pradesh 11,129 Himachal Pradesh 37 50 53 60 9,082 Punjab 8,949 Haryana 7,519 Tamil Nadu 6,988 Jammu & Kashmir 53 12 43 31 50 61 6,789 West Bengal 6,581 Gujarat 6,553 Assam 6,362 Karnataka 5,961 Maharashtra 5,957 Chhattisgarh 24 24 54 5,761 Odisha Private expenditure per student enrolled in private school 5,694 Uttaranchal 5,507 Andhra Pradesh 55 79 49 23 18 5,413 Kerala 4,872 Rajasthan 4,696 Jharkhand 4,630 Bihar 3,866 Madhya Pradesh 31 3,107 Uttar Pradesh 54 0 2,000 4,000 6,000 8,000 10,000 12,000
Ratio of Public to Private Expenditure Uttarakhand 3.62 Uttar Pradesh 2.98 Jammu & Kashmir 2.62 Andhra Pradesh 2.52 Himachal Pradesh 2.43 Rajasthan 2.38 Madhya Pradesh 2.09 Chhattisgarh 2.04 Gujarat 2.03 Haryana 1.99 Assam 1.66 Odisha 1.46 Jharkhand 1.28 Bihar 0.98 West Bengal 0.88 Punjab 0.83 0 0.5 1 1.5 2 2.5 3 3.5 4
What drives public expenditure? 80% of budget goes to Teachers * Proportion of budget on teacher salaries 100% 87% 90% 4% 80% 5% 80% 5% 66% 66% 70% 63% 59% 60% 50% Teachers School Children Management 40% 30% 20% 10% 0% 85% Andhra Pradesh Bihar Himachal Pradesh Madhya Pradesh Maharashtra Rajasthan 2013-14: Average of 6 PAISA States. Note: Teachers includes teacher salaries, training, teaching learning materials
Unpacking source of funding: Implications on decision-making? 100% 14% 15% 15% 16% 90% 38% 39% 80% 41% 53% 56% 70% 60% 60% 50% 86% 85% 85% 84% 40% 62% 61% 30% 59% 47% 44% 20% 40% 10% 0% 2010-11 2012-13 2010-11 2012-13 2010-11 2012-13 2010-11 2012-13 2010-11 2012-13 Bihar Rajasthan Madha Pradesh Himachal Pradesh Maharashtra State Budget (including MDM) SSA
Thank you AVANI KAPUR: AKAPUR@ACCOUNTABILITYINDIA.ORG AMBRISH DONGRE: ADONGRE@ACCOUNTABILITYINDIA.ORG


