Indian Community Health Assessment in NYC: Insights and Findings
Population data and findings from the Indian Community Health Resources and Needs Assessment conducted by the Center for the Study of Asian American Health in NYC. The assessment covers demographics, English language proficiency, education, employment, income, health status, health care access, barriers to care, overweight/obesity rates, access to healthy food, physical activity levels, and more. The assessment highlights health concerns, health insurance coverage, health care providers, medical services utilization, and challenges faced within the Indian community in NYC.

Download Presentation

Please find below an Image/Link to download the presentation.
The content on the website is provided AS IS for your information and personal use only. It may not be sold, licensed, or shared on other websites without obtaining consent from the author.If you encounter any issues during the download, it is possible that the publisher has removed the file from their server.
You are allowed to download the files provided on this website for personal or commercial use, subject to the condition that they are used lawfully. All files are the property of their respective owners.
The content on the website is provided AS IS for your information and personal use only. It may not be sold, licensed, or shared on other websites without obtaining consent from the author.
E N D
Presentation Transcript
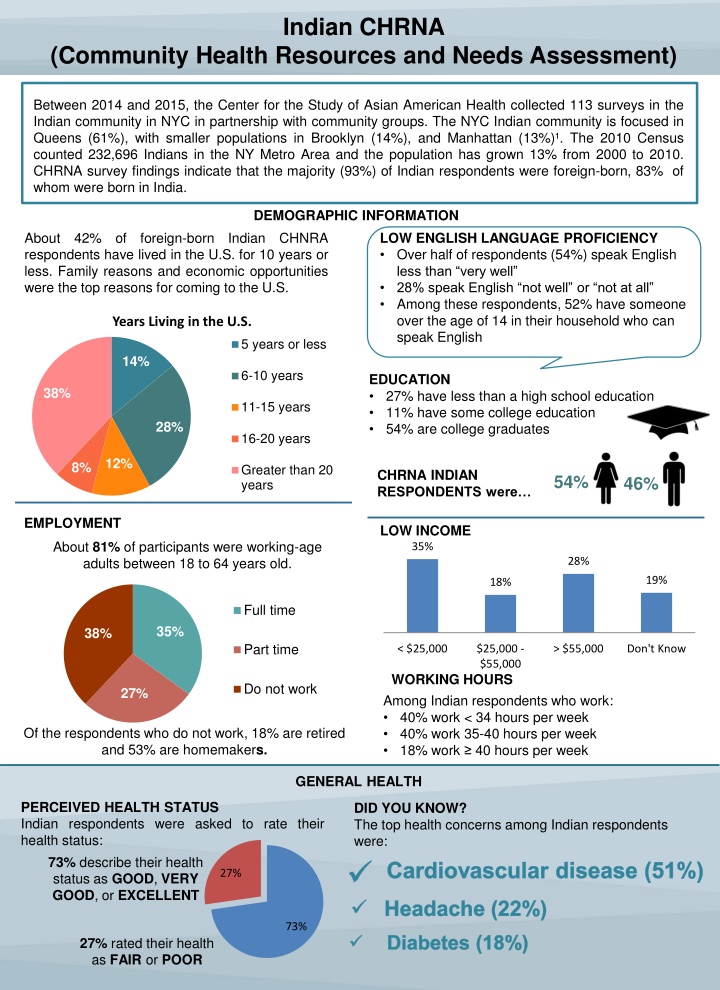
Indian CHRNA (Community Health Resources and Needs Assessment) Between 2014 and 2015, the Center for the Study of Asian American Health collected 113 surveys in the Indian community in NYC in partnership with community groups. The NYC Indian community is focused in Queens (61%), with smaller populations in Brooklyn (14%), and Manhattan (13%) . The 2010 Census counted 232,696 Indians in the NY Metro Area and the population has grown 13% from 2000 to 2010. CHRNA survey findings indicate that the majority (93%) of Indian respondents were foreign-born, 83% of whom were born in India. DEMOGRAPHIC INFORMATION About 42% of foreign-born Indian CHNRA respondents have lived in the U.S. for 10 years or less. Family reasons and economic opportunities were the top reasons for coming to the U.S. LOW ENGLISH LANGUAGE PROFICIENCY Over half of respondents (54%) speak English less than very well 28% speak English not well or not at all Among these respondents, 52% have someone over the age of 14 in their household who can speak English Years Living in the U.S. 5 years or less 14% 6-10 years EDUCATION 27% have less than a high school education 11% have some college education 54% are college graduates 38% 11-15 years 28% 16-20 years 12% 8% Greater than 20 years CHRNA INDIAN RESPONDENTS were 54% 46% EMPLOYMENT LOW INCOME 35% About 81% of participants were working-age adults between 18 to 64 years old. 28% 19% 18% Full time 35% 38% Part time < $25,000 $25,000 - $55,000 > $55,000 Don't Know WORKING HOURS Do not work 27% Among Indian respondents who work: 40% work < 34 hours per week 40% work 35-40 hours per week 18% work 40 hours per week Of the respondents who do not work, 18% are retired and 53% are homemakers. GENERAL HEALTH PERCEIVED HEALTH STATUS Indian respondents were asked to rate their health status: 73% describe their health status as GOOD, VERY GOOD, or EXCELLENT DID YOU KNOW? The top health concerns among Indian respondents were: Cardiovascular disease (51%) 27% Headache (22%) Diabetes (18%) 73% 27% rated their health as FAIR or POOR
HEALTH CARE ACCESS HEALTH INSURANCE COVERAGE HEALTH INFORMATION The Indian CHRNA respondents get their health information and hear about services primarily from: 32% have private or employer coverage 20%do not have health insurance 58% 47% 44% 45% areenrolled in public or government insurance coverage (Medicaid, Medicare, or other) Family Internet Friends HEALTH CARE PROVIDERS 5% do not have a regular health care provider Among those with a regular provider: 24% to some extent feel that their doctor looks down on them and the way they live their life 27% did not understand everything their doctor discussed with them during their last visit. MEDICAL EMERGENCY ROUTINE CHECKUPS VS. 29% of respondents visit the ER for medical attention when sick or injured BARRIERS TO HEALTH CARE 91% saw a health care provider for a routine physical checkup in the past year, in comparison to 88% of all New Yorkers2 3% of respondents have never had a check-up 45% see a private doctor when sick or injured 14% take medicine at home without consulting a doctor DID YOU KNOW? 17% of Indian CHRNA respondents reported difficulty obtaining necessary medical care, tests, or treatments in the last year. Reasons given were because of cost (54%) or because they could not get time off from work (15%). HEALTH PROFILE OVERWEIGHT/OBESITY ACCESS TO HEALTHY FOOD Body mass index (BMI) is a measure of body fat based on height and weight that applies to adult men and women. According to standard BMI measurements, about half of Indian respondents are overweight, with 11% registering as obese. In comparison, 33% of New Yorkers are overweight and 23% are obese.2 When using Asian proportions of overweight and obese Indian respondents shift to 48% and 30%, respectively. About 17% of survey participants sometimes worry about having enough money to buy nutritious meals 43% reported that their homes are a 10- minute-walk or more away from a place to buy fresh fruits and vegetables. BMI standards, the PHYSICAL ACTIVITY Sedentary lifestyle is related to many chronic diseases such as obesity, diabetes, heart diseases, and depression. 30% of Indian respondents do not engage in any weekly physical activity, compared to 26% of New Yorkers overall2 About 40% engage in sufficient weekly physical activity, compared to 67% of New Yorkers.2 Sufficient physical activity means spending >150 minutes per week engaging in moderate physical activity, > 75 minutes a week engaging in vigorous physical activity, or a combination of both
ORAL HEALTH IS INCREASED RISK OF DIABETES ONE OF THE TOP HEALTH CONCERNS About 44% of Indian CHRNA respondents rate their oral health as POOR or FAIR Frequent blood sugar level screenings are important to preventing and controlling diabetes 80% of Indian CHRNA respondents have received a check-up or screening for blood glucose in the past year 21% have been told by a health care provider that they have diabetes, more than the 11% of New Yorkers told the same thing2 73% of respondents with diabetes are currently taking medications prescribed by a health care provider MENTAL HEALTH STATUS A depression screening was used to determine how respondents would describe their feelings in the past 2 weeks: 2% of respondents may potentially benefit from mental health services From this at-risk group, about 50% are considered to have moderate depression 23% have been screened for depression in their lifetime Of these, 6% have been told by a health care provider that they have depression OSTEOPEROSIS Two risk factors that increase risk of osteoporosis in later life are: 1. Being of Asian descent 2. Being female RISK FOR CARDIOVASCULAR DISEASES Early screenings and intervention help to prevent negative health outcomes such as arthritis and joint injuries. 22% of female Indian CHNRA respondents 65+ years have never received a checkup or screening for bone mineral density High cholesterol levels and high blood pressure are risk factors of cardiovascular diseases (CVD), which can lead to heart disease and stroke. of respondents said CVD is a major concern for themselves or for their families 51% COMPARISON OF CANCER SCREENING RATES 100% 86% 80% of Indian CHRNA respondents received a checkup for cholesterol in the last year 36% have been told they have high cholesterol. In comparison, 30% of New Yorkers were told the same thing by their physicians2 69% of respondents with high cholesterol are currently taking medications for high cholesterol 83% of respondents had their blood pressure checked in the last year 21% have been told they have high blood pressure, while 29% of New Yorkers were told the same thing by their physicians2 87% of respondents with high blood pressure are currently taking medications for high blood pressure 78% 75% 80% 69% 67% 53% 60% 40% 20% 0% Colonoscopy Mammogram Pap smear Indian CHRNA New Yorkers Only 53% of Indian CHRNA respondents 50+ years old have received a colonoscopy compared to 69% of New Yorkers 50+ years old6 Approximately 81% of female Indian CHRNA respondents 21+ years have had a clinical breast exam 86% of female respondents 40+ years have had a mammogram in the past 2 years, as compared to 75% of New York women6 67% of female Indian CHRNA respondents have had a pap smear in the past 3 years, as compared to 78% of New York women5 DID YOU KNOW? 42% of male Indian CHNRA respondents 50+ years have never received a prostate exam.
SEASONAL FLU VACCINE SMOKING 8% of Indian CHRNA respondents are current smokers, compared to 16% of New Yorkers2 13% of respondents are current smokers, compared to 20% of New York men2 1% of women surveyed are current smokers; in comparison, 13% of New York women are current smokers2 55% of Indian CHRNA respondents received the flu vaccine in the past year, on par with the 56% of all New Yorkers2 male CHRNA 100% 44% 45% 50% 56% 55% 0% Indian CHRNA New Yorkers ALCOHOL 23% of Indian CHRNA respondents are current drinkers Of these, about 46% have consumed 5 or more drinks on one occasion at least once in the past 30 days, which is considered binge drinking In comparison, 18% of New Yorkers have had 5 or more drinks on one occasion at least once in the past 30 days2 Vaccinated Not Vaccinated NOT MEETING SLEEP RECOMMENDATIONS Sleep supports healthy brain function to ensure good mental and physical health. A lack of adequate sleep can impact how well a person thinks, works, learns, or gets along with others.4 Only 48% of Indian respondents reported getting the recommended number of hours of sleep. TUBERCULOSIS Approximately respondents have previously had a tuberculosis (TB) test. 0% reported a history of infection with TB, although 6% reported that they were unsure if they ve ever been diagnosed 72% of Indian CHRNA 7-9 hours is the recommended amount for healthy adults < 7 hours 47% 7-9 hours 48% Fell asleep during the day 28% HEPATITIS B Asian Americans are at higher risk for Hepatitis B, but many who are infected do not know it3 28% of Indian CHRNA respondents have never been screened for hepatitis B Of those who have been screened, about 3% have been diagnosed with hepatitis B 0% 50% 100% 28% of respondents reported unintentionally fallingasleep during the day SOCIAL ENVIRONMENT RELIGIOSITY Islam 8% NEIGHBORHOOD Among religious Indian CHRNA respondents, 69% go to their house of worship at least once per week 69% pray at least once a day 82% of Indian CHRNA respondents believe people in their neighborhood are trustful 86% believe people in their neighborhood get along well together 82% believe their neighbors look out for each other 84% believe that their neighbors would offer assistance in the event of an emergency Sikhism 35% Hinduism 42%
CONCLUSION The Indian CHRNA results are aligned with the public health literature which indicates that significant health disparities exist in Asian American subgroups. Low levels of English language proficiency and high rates of poverty were noted in the Indian community. Rates of certain types of health screenings for cervical and colon cancer were relatively low in the Indian population surveyed compared to New Yorkers in general. High rates of diabetes were also noted in the Indian population surveyed compared to New Yorkers in general. Health Promotion Developing community-based health promotion and preventive healthcare (such as screening activities) in partnerships with Indian-serving community-based organizations is essential to improving the health and well-being of the Indian community. Citations: 1. Asian American Federation, Asian Americans in NYC, April 2013 2. New York City comparison data derived from the New York City Department of Health and Mental Hygiene s EpiQuery: NYC Interactive Health, 2013 NYC Community Health Survey data at http://on.nyc.gov/1Cf1RAt. 3. Center for Disease Control and Prevention. Asian Americans and Hepatitis B CDC Features. http://www.cdc.gov/features/aapihepatitisb/ 4. National Institute of Health. "Why Is Sleep Important?" NHLBI, NIH. http://1.usa.gov/1zdBlfa. 5. New York City comparison data derived from New York City Department of Health and Mental Hygiene s EpiQuery: NYC Interactive Health, 2010 Survey Trends data at http://on.nyc.gov/1AnvDsL 6.New York City comparison data derived from New York City Department of Health and Mental Hygiene s EpiQuery: NYC Interactive Health, 2012 Survey Trends data at http://on.nyc.gov/1AnvDsL This study was supported by P60MD000538 from the National Institutes of Health-National Institute on Minority Health and Health Disparities The mission of the NYU Center for the Study of Asian American Health (CSAAH) is to identify health priorities and reduce health disparities in the Asian American community through research, training and partnership. med.nyu.edu/asian-health For more information about this project, please contact: Catlin Rideout, MPH Program Manager Center for the Study of Asian American Health catlin.rideout@nyumc.org 212-263-7869